IESRE believes these sources to be reliable, but can accept no responsibility for content linked from this document. Some links may require online subscriptions to access them. IESRE president David Brooks takes responsibility for the contents of this page.
August 13, 2022: The White Ibis moves to New Jersey.
The Philadelphia Inquirer reports that in 2019 a dozen distinctive white ibises were observed at New Jesey's Ocean City Welcome Center. These birds normanormally live in Florida and the southeast. The number increased year- by-year and it's now estimated that at least 350 of thes bids live in the salt marshes of New Jersey.
Although there may be several reasons for this expansion, climate change is likely the major driving factor, resulting from warming air and water in coastal new Jersey. These birds are photogenic and very easy to identify, so they are popular with birders. But they may be detrimental to other smaller traditionally native birds that share the same food sources and habitat needs. So, the adoption of this new white ibis home may not be entirely without some negative ecological consequences.

February 18, 2022: EPA Report on U.S. Power Plant Emissions
THIS DOCUMENT gives data about emissions of SO2, NOx and CO2 emission from U.S. power plants. Emissions of the greenhouse gas CO2 have decreased by only 21% from 1995 to 2021. The drop in those emissions due to COVID-19 shutdowns in 2020 were reversed in 2021. The overall downward trend seen from about 2007 is encouraging, but nowhere as large as it should be to bring global warming under control. Drops in SO2 and NOx emissions are much larger. From this site, you can download Excel files containing data used to generate the charts and maps in the report.
February 10, 2022: "Natural Gas" – what's in a name??
THIS ARTICLE from Vox.com describes how a fossil fuel known as "natural gas" has distorted the negative environmental impact of this fuel. So-called natural gas is essentially methane, 80 times more powerful as a greenhouse (heat-trapping) gas than CO2. Although the oil and gas industry didn't invent this name, given since its discovery in the early 19th century, it has taken advantage of the willingness of people to associate "natural" with "good." Because one source of methane is by the "natural" decomposition of trash in landfills, natural gas is even touted as a "renewable" resource. While technically true, this grossly misrepresents the negative effects of a rapidly rising concentration of methane in the atmosphere.
The oil and gas industry has also promoted natural gas as a vast improvement over using coal for power production and they have described it as a necessary "bridge" fuel in the process of eliminating fossil fuel sources from our energy economy. The validity of these claims is a reasonable topic for debate, but that debate is seriously skewed by a conscious misuse of two little words: "natural gas."
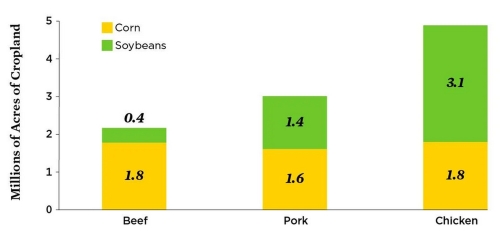
February 9, 2022: Raising grains for meat production
A RECENT ARTICLE from the Union of Concerned Scientists explored the huge impact of food production for meat products. Tyson Foods is one of the largest food companies in the world. They use over 9,000,000 acres of land to produce food for their meat products – an area roughly twice the size of New Jersey. Only about 5% of this land uses sustainable farming practices that minimize negative environmental and health effects of monoculture agriculture that is prevalent in the U.S. This graph breaks down corn and soybean production.
January 27, 2022: EPA document about airborne particulates
It's well established that airborne particulates, especially those less than about 10 microns in diameter, pose significant environmental and health problems (e.g., making lakes and streams more acidic, aggravating asthma). Not surprisingly, negative health effects are more likely to be encountered in economically depressed and minority communities because they are more likely to be near sources of airborne particulates. HERE is a link to a nice web page about particulates from the U.S. Environmental Protection Agency.
See HERE for information about Brooks' book, Monitoring Your Environment with Arduino Microcontrollers, for information about environmental monitoring in general and, in particular, about inexpensive systems for measuring airborne particulates.
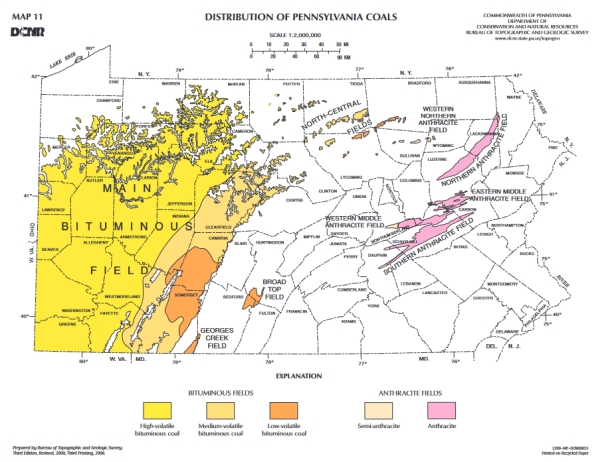
January 20, 2022: Coal Mining in Pennsylvania
Using coal for generating electricity is one of the most significant sources of greenhouse gases leading to global warming. Coal mining in Pennsylvania dates back to the 18th century and remains a major industry. Why? The map below from Pennsylvania's Department of Conservation and Natural Resources (DCNR) provides the answer: Southwestern Pennsylvania is essentially one giant bituminous ("soft") coal field and higher quality ("hard") anthracite coal fields are found in the northeast. Although mining activity peaked in the early 20th century, there are still around 40 active underground mines in Pennsylvania and altogether about 240 active mining sites, including surface mines. Details about these ongoing activities can be found here, for bituminous and anthracite coal. Although all of these mining activities have shown decreases between 2019 and 2020, there are still more than 4600 employees in the coal extraction business in Pennsylvania and mining is still a major economic driver in parts of the commonwealth.
In addition to coal's huge contribution to CO2 emissions into Earth's atmosphere, hazardous waste from active and inactive mining operations is a major source of pollution, especially of Pennsylvania's waterways. There are very active and politically influential organizations (Pennsyvania Coal Alliance, American Coal Council, National Mining Association, National Coal Council) that lobby in support of coal mining in the U.S. and Pennsylvania. See HERE for links to these organizations and more information about this industry.
January 13, 2022: Global Temperatures in 2021
An online paper by James Hansen, Makiko Sato, and Reto Ruedy provides an extensive analysis of global temperatures during 2021. One interesting point is that the effects of a changing climate are becoming more noticeable because warming over land is much larger than warming over oceans. A possible cause for this is decreasing atmospheric aerosols due to an increased use of cleaner cars and power generation plants.
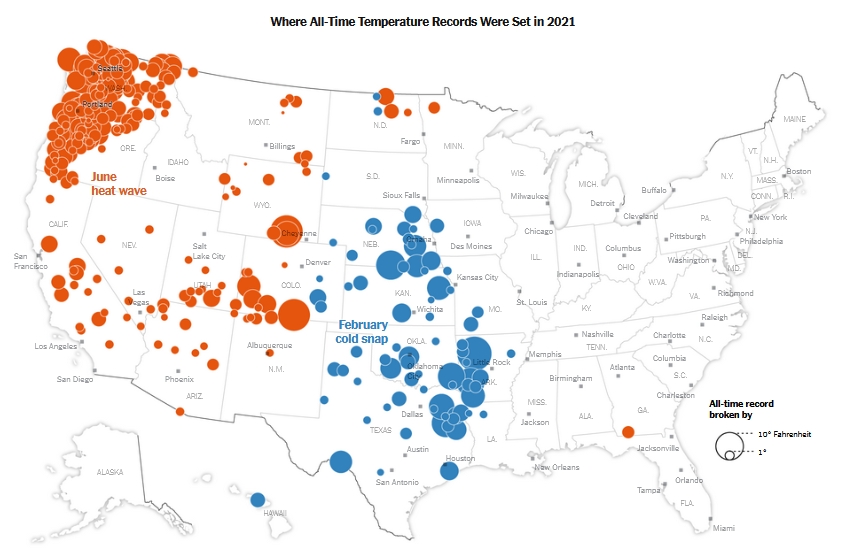
January 12, 2022: High and low U.S. temperature records in 2021
Anyone paying even the slightest attention to the weather already knows that there were many extreme weather events in the U.S during 2021. These include more hot and cold records than any year since 1994. There were more heat records set, almost all west of the Mississippi, than in any year since digitally recorded temperature data were recorded nationwide syarting in 1948. In some places, hot and cold temperature records eclipsed values extending back into the late 19th and early 20th centuries. In June, Salem, Oregon, recorded a temperature of 117° – a place where the normal June high is only in the mid 70's. In February, the temperature fell to -6° in Jacksonville, Texas, where the normal low would be about 40°. In some places there were abnormally large numbers of temperature-related deaths.
This graphic is from a NY Times article, which may be accessible only with an online account.
November 18: Defining "Waters of the United States"
The Clean Water Act of 1972 prohibits the discharge of pollutants from any point source to "navigable waters" defined as "the waters of the United States, including the territorial seas." This critical phrase isn't defined by the Act, but rather by the EPA and the Army (Corps of Engineers?). Clarifying the definition of waters of the United States is critical to protecting all users of this critical resource and others who depend on having this resource protected. See HERE for an EPA document with more information.
November 16, 2021: about the future of nuclear power
The role of nuclear power in a fossil fuel-free energy future has been hotly debated for many years. There is a growing understanding of the basic reality that integrating variable power sources like wind and solar into an electricity-generating system requires continuously reliable and predictable outputs from "baseload" plants. That reality currently includes both fossil-fueled and nuclear power plants. Eliminating the fossil-fueled plants, including even natural gas-powered plants, requires alternatives that do not yet exist.
Progress is being made on energy storage systems that will allow solar and wind sources to provide the input/output stability that a working power grid requires. Building new solar and wind generation is already cost-competitive or cheaper per megawatt than building new fossil fuel generation, but there is growing concern that energy storage solutions for intermittent sources are not developing fast enough to transition to a power grid that no longer generates the greenhouse gases that produce climate-changing global warming.
In fact, the only currently feasible solution to the challenging problems with integrating intermittent power generation into a power grid without fossil fuels appears to be continuing to use existing nuclear power plants and construct new ones. But, large scale nuclear plants, which a couple of generations ago were hyped as generating electricity "too cheap to meter," (see, for example, HERE) still have major "growing pains" with serious safety, environmental, and cost issues. Some countries are working to solve these problems (including just by ignoring the very real problems with nuclear power generation and radioactive waste disposal) and some countries are simply giving up on nuclear power. In the U.S., there are currently only 55 commercial nuclear power plants with a total of 93 working reactors. There are only two new reactors under construction, at a plant in Georgia. (See HERE.)
Several companies are working on smaller nuclear generation plants based on allegedly fail-safe designs that eliminate the potential for "run away" disasters such as occurred at Chernobyl (Ukraine), Fukushima (Japan), and Three Mile Island (U.S.). HERE is an interesting article that explores the current state of some of these efforts. HERE is another article about SMRs (small modular reactors). In principle, these SMRs may ultimately (but not yet) be more cost-effective to build and safer to operate than larger plants. Nobody yet knows when or even whether these newer designs will be successful in helping the world move toward a fossil fuel-free energy production environment!
November 14, 2021: Methane gets attention at COP26
Although anthropogenic carbon dioxide (CO2) emissions, primarily from the burning of fossil fuels, is the most widely researched and discussed source of greenhouse gas, the COP26 conference also focused for the first time on methane. There's a lot of online information about methane: See HERE and HERE, for example.
Methane is a primary component of natural gas and also comes from a variety of other anthropogenic and natural sources. (Methane from ruminant animals such as cattle have recently received some attention.) It's more than 25 times more powerful than CO2 as a greenhouse gas (as an absorber of infrared radiation in Earth's atmosphere). It stays in the atmosphere for about 12 years, whereas CO2 stays for hundreds of years, so reducing methane sources can have a very significant short-term impact on global warming. Fossil fuel extraction facilities (including even coal mines) are major sources of methane gas. It's by itself an efficient fuel and it's therefore potentially profitable to capture this gas rather than venting it to the atmosphere. (See HERE, for example.}
At COP26, more than 100 countries agreed to cut methane emissions by 30 percent by the end of the decade. The U.S. and China signed a separate joint agreement to develop a methane reduction plan. Although all these agreements lack enforcement mechanisms and timelines, recognizing the importance of reducing methane emissions is at least a significant positive development.
November 13, 2021: Final agreement from COP26
HERE is an annotated version of the final COP26 agreement. Negotiations continued into "overtime," with a final agreement reached today. A previous version calling for the "the phasing-out of coal and subsidies for fossil fuels" has been watered down at the insistence of negotiators from China and India, both heavily dependent on coal production and use. The final relevant section replaces "phaseout" with phase-down," and now reads:
Calls upon Parties to accelerate the development, deployment and dissemination of technologies, and the adoption of policies, to transition towards low-emission energy systems, including by rapidly scaling up the deployment of clean power generation and energy efficiency measures, including accelerating efforts towards the phase-down of unabated coal power and inefficient fossil fuel subsidies, recognizing the need for support towards a just transition;
Some observers have expressed surprise that this section survived at all in the final ducument, but this very significant change in just one word, which still has no time line associated with it, allows considerably more "wiggle room" to continue using fossil fuels. "Unabated coal power and... inefficient subsidies..." will be taken to allow the continued use and construction of, coal-fueled and other fossil-fueled power plants that have some degree of carbon capture technology. The definition of "inefficient" subsidies will no doubt be debated ad infinitum!
The widely held belief among climate scientists is that this agreement, and in particular the section on coal and fossil fuel use and the lack of enforceable time-related targets for reducing greenhouse gas emissions, does not come even close to meeting the goal of no more than a 1.5°C global temperature rise above pre-industrial levels believed necessary to prevent the most serious and irreversible effects of changing Earth's climate through human activities.
November 10, 2021: Draft agreement from COP26
HERE is the draft agreement from the COP26 climate summit in Glasgow, Scotland. (Note that the date, 10/11/2021, uses the European convention for specifying day/month/year rather than month/day/year as is done in the U.S.) As just a draft it is of course subject to change. For the first time, such a document has called specifically for "the phasing-out of coal and subsidies for fossil fuels." Even if this wording remains in the final document, it is highly unlikely that countries such as China and India, which still rely heavily on coal for electricity production and are, in fact, planning to increase rather than decrease coal production and consumption at least in the near-term, will respond to this call.
November 2, 2021: Extremely high UV index values during heat wave in La Paz, Bolivia
THIS LINK describes UV index values as high as 21 during a heat wave in La Paz, the administrative capital of Bolivia. December and January, summer months in the southern hemisphere, typically have the highest UV values, but a prolonged heatwave and abnormally low cloud cover have produced these high levels. At an elevation of 3,600 meters (11,800 feet), La Paz often records summer UV index values in the 11-17 range. Some climate scientists believe climate change is responsible for changes in rainfall patterns, low cloud cover, and intense heat in La Paz, all of which are responsible for these high UV levels.
UV index values as high as 40 have been recorded at sites in the high Andes mountains. Any value above 10 is considered to be "extreme" and humans are advised to avoid exposure to direct sunlight under these conditions.
It's not known how long the URL cited above will be accessible.
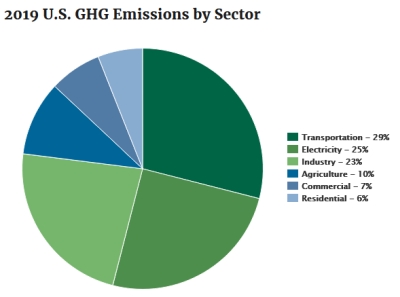
October 18, 2021: Sources of greenhouse gas emissions in the U.S.
This "Fast Facts" publication from the U.S. Environmental Protection Administration shows sources of U.S. greenhouse gas emissions as of 2019. Nearly 30 percent of all U.S. emissions come from the transportation sector, with "light-duty vehicles" – automobiles, essentially – contributing almost 60% of transportation emissions.
This document also includes links to previous versions of these data, back to 2015, that may show how emissions sources are changing over time.
September 8, 2021: Rising temperatures are the world's greatest public health threat
An editorial simultaneously published worldwide in more than 200 scientific journals has called rising temperature the world's greatest public health threat. You can see this editorial HERE in the British medical journal The Lancet, along with links to downloadable supplementary material. THE LANCET is one of the world's most respected and prestigious medical journals.
The conclusions in this editorial about the negative consequences of unchecked climate change and global warming aren't new, and all have been expressed previously in multiple outlets over many years. What is striking about this editorial is the urgency of the message and the coordination among so many scientific outlets.
September 7, 2021: Climate change skepticism and denial
I've been thinking recently about the relationship between "climate skepticism" and "climate denial." A basic issue is the extent to which climate change skepticism almost exclusively lands on the side of considering that climate change proponents, at best, overestimate the role of anthropogenic influences on climate and its negative impacts in both the present and the future or, at worst, that climate change proponents deliberately "cherry pick" data and promote negative impacts for ideological or financial reasons, or both – "Of course, climate scientists want us to believe that X bad things will happen because their grant funding and professional status depend on it." or because those beliefs are consistent with their political positions on a variety of topics.
Of course, analyses and projections about current and future climate can be wrong in either direction, minimizing or over-estimating their negative impacts. Climate skeptics tend to be politically and religiously conservative on a variety of topics. And, it's true that climate skeptics and deniers can also "cherry pick" data. But, climate science skeptics invariably assume that climate change proponents always over-estimate negative impacts. In fact (see July 20 posting, below), there is growing evidence that some past models and predictions about climate change are now proving to underestimate rather than overestimate the speed and extent of negative climate changes. Where are the skeptics here?
There is some literature available online about the relationship between skepticism and denial. THIS ARTICLE was published in 2015, but its analysis does not seem outdated in any way. It's a scholarly article, and not a quick or easy read. But it is suggested reading for anyone who wants to understand climate skeptics!
September 5, 2021: EPA report on the links between climate change and "social vulnerability"
Not surprisingly, there are significant differences in how climate change affects different population groups. This September, 2021, EPA report Climate Change and Social Vulnerability in the United States, "improves our understanding of the degree to which four socially vulnerable populations — defined based on income, educational attainment, race and ethnicity, and age...may be more exposed to the highest impacts of climate change." The report has been written in response to the Biden Administration's Executive Order 14008, Attacking the Climate Crisis at Home and Abroad.
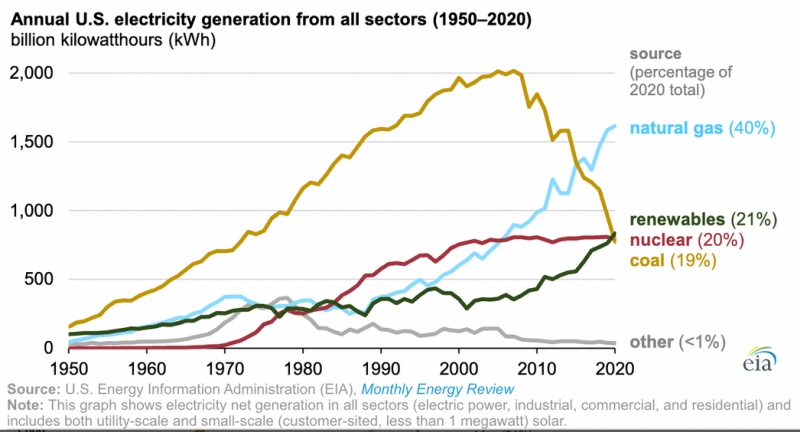
August 26, 2021: U.S. electricity generation
Here's an interesting graphic from THIS SOURCE, taken from the U.S. Energy Information Administration's Monthly Energy Review. The graphic shows clearly the precipitous drop in coal-produced electricity and the rapid increase of natural gas. Renewables are just starting what looks like an exponential increase in the 21st century.
August 21, 2021: Rainfall at the summit of Greenland
If you think of Greenland as a place just for ice and snow, you can now broaden that perspective. Air temperatures at the summit of Greenland's ice sheet rose above freezing for the third time in less than a decade. For the first time on record, precipitation fell as rain rather than snow, resulting in dumping an estimated 7 billion tons of rainwater on the ice sheet. This will have serious short- and long-term effects on how the ice sheet melts, increasing runoff that raises sea levels. Read more about this event online, including HERE.
August 9, 2021: Sixth Assessment Report from the IPCC released

The most recent report from the Intergovernmental Panel on Climate Change (IPCC) is available online HERE. A "headline" summary of the report's major findings can be downloaded HERE. Certainly one of the most striking conclusions is that the attribution of global warming to human activities has evolved to the point that the report now states that (emphasis added) "It is unequivocal that human influence has warmed the atmosphere, ocean and land." And, that (emphasis added) "Global surface temperature will continue to increase until at least the mid-century under all emissions scenarios considered." Most strikingly, the report concludes that "Many changes due to past and future greenhouse gas emissions are irreversible for centuries to millennia, especially changes in the ocean, ice sheets and global sea level."
No doubt, climate skeptics and deniers will continue to dismiss this IPCC report, as they have all past IPCC reports, as scientifically unsound, biased, and unjustifiably alarmist. However, some recent studies (see the entry below for July 20, 2021) have concluded that some IPCC predictions have been too conservative and that negative effects of climate change are, in fact, occurring sooner than predicted.
Whether 2021's incredible ongoing string of catastrophic weather events can be associated specifically with anthropogenic climate changes will continue to be debated. But this report makes compelling cases for moving rapidly toward a post-fossil-fuel, carbon-neutral economy and finding new ways to prevent minimize emissions of other greenhouse gases such as methane.
August 3, 2021: Site with information about Arctic sea ice
THIS SITE from the Danish "Polar Portal" contains a LOT of information about conditions in the Arctic and, particularly, the state of the Greenland Ice Sheet and sea ice in the Arctic. The rate of melting of the Greenland Ice Sheet is increasing dramatically, leading to an increasing rate of sea level rise. Data show that the extent of summer Arctic sea ice is 30% smaller than in the early 1980s. Sea ice is highly reflective. Decreasing sea ice allows more sunlight to be absorbed in dark ocean waters, which further reduces ice formation and retention. This "positive feedback" effect has profound implications for climate changes in other parts of the world.
July 20, 2021: IPCC climate predictions too conservative
Future climate predictions published by the Intergovernmental Panel on Climate Change (IPCC) are often targeted by climate change deniers and skeptics as being too "alarmist." It is true that some specific IPCC predictions based on climate models have proven not to be reliable. But, with the recent onslaught of horrific and unprecedented weather conditions around the globe, many climate scientists are now pointing out that IPCC predictions, especially about climate-change exacerbated extreme weather events, have been too conservative rather than too alarmist.
This isn't even a new idea. A 2012(!) article in Scientific American states that "Checking 20 years worth of [climate] projections shows that the Intergovernmental Panel on Climate Change has consistently underestimated the pace and impacts of global warming."
A 2019 article in Science Daily states that A new study has revealed that the language used by the global climate change watch-dog, the Intergovernmental Panel on Climate Change (IPCC) is overly conservative and therefore the threats are much greater than the Panel's reports suggest.
Even the "Skeptical Science" website has an article entitled "How the IPCC is more likely to underestimate the climate response" to human activity.
It is, of course, always possible to "cherry pick" data to "prove" that IPCC predictions are too alarmist or too conservative. However, weather conditions in 2021, such as unprecedented high temperatures in the Arctic, an early start to the fire season in the U.S. west, record heat waves and drought conditions in the U.S. Pacific and southwestern Canada, all of which are believed by most climate scientists to be exacerbated by climate change, make the "alarmist" position increasingly difficult to maintain.
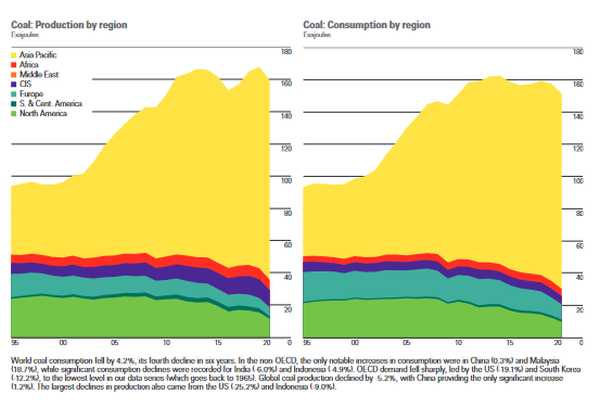
July 12, 2021: BP's Statistical Review of World Energy 2021
You might not think of looking to a large global petroleum company – BP, formerly British Petroleum – for reliable information about world energy use. But 2021 marked the 70th edition of BP's Statistical Review of World Energy. This document contains comprehensive information about energy production, generation, and consumption for fossil and renewable fuels, information about "key minerals" required for various energy sectors, and global CO2 emissions. There are literally dozens of tables and graphs about all these topics. To pick just one, consider the question of who is producing and using coal. This is a critical issue for determining how the world can transition away from fossil fuels to a newable energy future. A popular argument from some sides of this issue is to note that we will never get to a renewable energy future as long as developing countries continue to rely on coal, which is the worst contributor to CO2 emissions of all fossil fuels.
This chart shows production and consumption of coal, by region, in units of exajoules (1 exajoule = 1018 joules). The Asia Pacific is by far the largest producer and consumer of coal of all regions. Perhaps as a result of the 2020 global pandemic, overall coal production and consumption for the region decreased very slightly in 2020. But coal production in China, which represents over half of all coal production and consumption in the Asia Pacific region, increased by 1.2% in 2020, over 2019, and 2.7% per annum between 2000 and 2019.
The case is often made that global transitioning to a renewable energy future depends on finding ways to allow underdeveloped countries, many of which are in the Asia Pacific region, to continue their economic development that now depends overwhelmingly on fossil fuels. However, a more pertinent and more narrowly drawn question is how to convince China, with its rapid growth in an already relatively highly developed economy, to greatly reduce its reliance on coal as a source of power.
July 11, 2021: Link to articles about warming in regions around the globe.
HERE is a link to some Washington Post articles about warming in various regions around the globe. One article describes the 3°C rise in temperature from preindustrial times in Siberia. Another describes how ice loss in the Arctic is accelerating coastal erosion in places where sea ice formerly protected the land from heavy seas. Closer to home, another article describes the 2°C rise in temperatures during the last century at Lake Hopatcong in New Jersey -- a place where, in the early 20th century, ice fishing and ice boat racing were once popular winter sports and the lake served as a source of huge blocks of ice sent in refrigerated train cars for use in places like New York city before electricity-powered refrigeration was possible or common; none of these activites are feasible now. This year, following one of the warmest springs of the last century, New Jersey's environmental agency warned – just as the summer tourist season began – against swimming or fishing in Lake Hopatcong "for weeks, if not longer" because of toxic blue-green algae. In some New Jersey counties, average winter temperatures now exceed 0°C, with measurable effects on flora and fauna, such as the persistence of agricultural pests and disease-carrying mosquitoes that used to be eradicated or controlled by cold winters.
In this map, air temperatures in areas in red and darker have already increased by 2°C since the industrial revolution – the amount deemed critical as a "tipping point" for irreversible impacts of a changing climate. Some, but not all, of these hot spots are near urban, developed, areas. It is often argued that rising temperatures in such areas aren't caused by "real" climate change, but are a result of development-produced "heat islands." This may be true, but is also not really the point, as the effects of warming temperatures are real regardless of their cause. The article about Lake Hopatcong includes a detailed section about "How we [obtained and] analyzed the data."

It's popular among climate change skeptics or deniers to accuse media like The Washington Post as being too biased to be trusted. However, for articles like this, the worst that can be said is that stories and supporting data may sometimes be "cherry picked" to make a point, rather than inaccurate.
July 8, 2021: Is record heat in the Pacific Northwest caused by climate change?
An article published June 29, 2021,in the NY Times, by Michael Mann (of "hockey stick" fame, and a controversial pawn in climate change politics) and Susan Joy Hassol answered the question like this:
"Might a heat dome have developed out West this past week without climate change? Sure. Might it have been as extreme as what we’re witnessing without climate change? Almost surely not."
The article was published several days before temperatures rose even higher and more records were broken in the U.S. Northwest and southwestern Canada. The article explains that the heat dome is caused by a high pressure system locked in position over the U.S. Northwest and southwest Canada, resulting from an "omega block pattern" in the jet stream caused by rapid warming in the Arctic.
You may need a NY Times digital subscription to view this article. But HERE is another freely available article from World Weather Attribution reaching the same conclusion – that the "Western North American extreme heat [is] virtually impossible without human-caused climate change" That same source reaches the same conclusion that the record breaking temperatures in Siberia in 2020 were almost impossible without climate change" and that the record European heatwave in 2019 "would have been extremely unlikely without climate change".
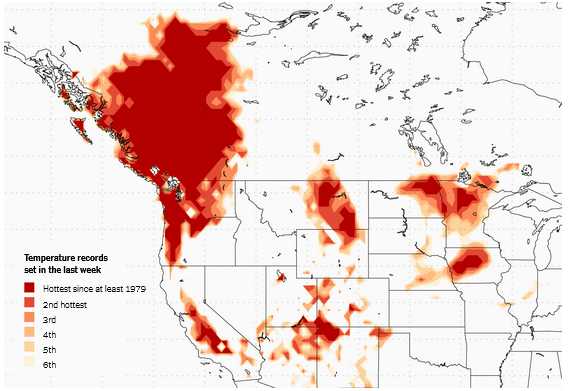
July 7, 2021: Record heat in the U.S.
This map, produced by a climate researcher at the Royal Netherlands Meteorological Institute, and published by the NY Times, shows the record-shattering temperatures in the U.S. and western Canada during this week. More very high and record-high temperatures from another "heat dome" are forecast into next week (See, e.g., HERE.)
July 7, 2021: Droughts and civilization
HERE is an interesting article about the effects of climate-induced droughts on past civilizations and the implications of extended droughts in the western U.S. The article posits that if current conditions in the West continue, driven by ongoing anthropogenic impacts on global and regional climate, agricultural and other activities are ultimately unsustainable.
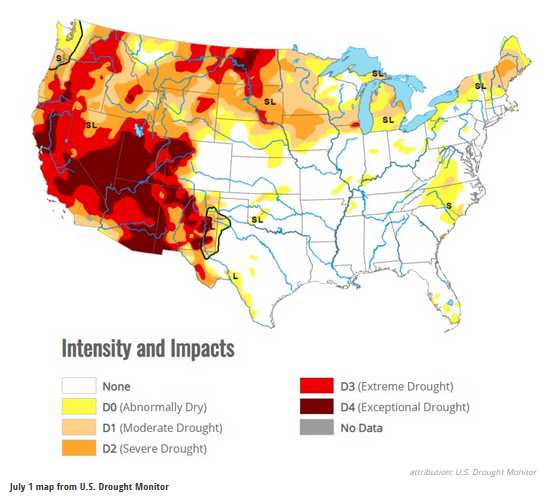
You can find out who sponsors the U.S. Drought Monitor (including the National Oceanic and Atmospheric Adminsitration and the U.S. Department of Agriculture) and more about the data used to generate the map HERE
The author of the article is on the staff of Daily Kos, a very left-leaning news source and media outlet. While it is important always to consider the source of articles like this, the map of current drought conditions is simply factual and concerns about the impact of the current drought and its long-lasting consequences are legitimate and widely shared.
July 4, 2021: Surface temperatures in western Canada
It's been extensively reported that the Pacific Northwest – western U.S. and Canada – has been trapped under a massive "heat dome" for several days. Daytime air temperatures above 110°F are now common in the American West, and multiple locations have broken long-standing heat records for several days in a row, often by several degrees. As of this date, relief is not yet in sight.
Here's an interesting map of ground surface temperatures in Canada just north of the U.S. border. (See HERE for source of this image, with data from the European Space Agency's Sentinel-3 satellite.) These values are typically higher than air temperatures. Ground temperatures as high as 145°F (63°C) have been reported in Washington state – new records. As air temperatures rise, the ground heats up and can hold heat for a long time, due to "thermal inertia," which exacerbates and prolongs the effects of heat waves. This is especially true in urban settings where materials like concrete and asphalt have a much higher ability to retain heat than natural surfaces, creating the well-known heat island effect.
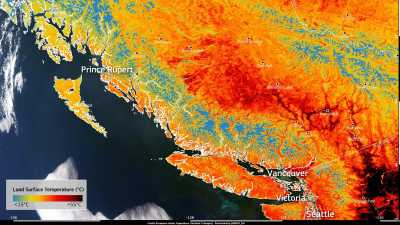
It can be (and is) argued that it's not currently possible to assign "climate change" as the cause of this extreme heat event. But what is well established is that rapid Arctic warming – clearly related to a warming globe – has caused very significant changes in the jet stream which, under some circumstances, can allow high pressure centers like the current heat dome to remain in place for many days as is happening now in the Pacific Northwest.
June 9, 2021: What do do with solar panels at their end of life?
THIS ARTICLE from wired.com discusses the environmental problems caused by solar panels – a rapidly increasing source of renewable energy. Current solar panels have estimated useful lifetimes of around 25 years and major solar panel deployments started in the early 2000s. So, questions about how to recyle solar panels urgently need answers.
It's already well known that recycling of electronics in general is very poorly developed. A lot of what we would like to think of as recyclable is still just being sent to landfills. The basic problem, described in this article, is that recycling solar panels is a high-tech undertaking for which the cost to recycle solar panels FAR exceeds the market value of the recycled materials.
June 5, 2021: Climate change influence on monsoons
The summer monsoon in South Asia begins in June. The abstract in a new study in the journal Science Advances, published by the American Association for the Advancement of Science (AAAS), opens with: "South Asian precipitation amount and extreme variability are predicted to increase due to thermodynamic effects of increased 21st-century greenhouse gasses..." Computer models of how a changing climate will affect future monsoons have been validated by comparing climate conditions obtained from sediment core samples taken in the Bay of Bengal. The data from the sediment layers date back almost a million years. Observers agree that monsoons in India are getting wetter (through more and more extreme precipitation), interspersed with longer and more severe droughts. Building on theory and observations of past links between climate and monsoons, computer models predict that this problem will continue to worsen in the future.
May 31, 2021: Climate change and heat-related deaths
A posting earlier this month included a link to a webpage that discussed the debate over whether extreme heat or extreme cold is responsible for more deaths; the consensus seems to be that there is no definitive answer to this question. A different question is whether extreme heat events, which are becoming more frequent and more severe in some parts of the world, are increasing heat-related deaths. A May 31, 2021, article in Nature Climate Change, summarized HERE, states in the abstract that "37.0%... of warm-season heat-related deaths can be attributed to anthropogenic climate change and that increased mortality is evident on every continent." The article abstract (but not the entire article) is available for viewing HERE. Although it is certain that some will quibble with the article's data sources and methodology, as well as the numbers in the results, the journal is peer-reviewed and widely respected within the science community.
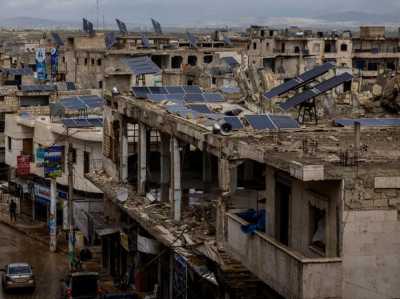
May 28,2021: Solar Boom in Syria
| From the viewpoint of how electricity is generated and used in western countries, a personal commitment to solar power may seem to be an "elitist" response to climate change, as a way to reduce our reliance on fossil fuels. But in war-torn parts of Syria, the lack of a reliable electrical grid, or any working grid at all, forced residents to depend on very dirty locally refined oil to power noisy and air-polluting generators. Gasoline and diesel fuel became very expensive. It was of such low quality that the generators used to power everything from single homes to entire apartment buildings and businesses required constant, costly maintenance. The solution? Many local entrepreneurs who provided generators switched to solar/battery systems, which are now widely distributed. This process is described in a MAY 15 ARTICLE from the NY Times. Regardless of the motivation involved, this remarkable "solar revolution" will probably spread and continue even in situations where alternatives are less onerous. |
 |
May, 2021: Which kills more people: extreme heat or extreme cold?
Because global temperatures are rising, it's often claimed that deaths from extreme heat are increasing due to "climate change." That's true, but is that more of a problem than deaths from extreme cold? Determining whether extreme heat or extreme cold kills more people is complicated! The answer depends on who's asking the question, where data come from, and how those data are analyzed. In particular, the manner in which extreme weather – hot or cold – is responsible for increased mortality rates can make comparing heat deaths to cold deaths an "apples to oranges" comparison. There are sources of weather related deaths that are not necessarily directly due to temperature. For example, should deaths in cold weather due to improper use of indoor heaters or sparks from indoor or outdoor fires be accepted as "weather related"? Those deaths aren't even necessarily related to "extreme" cold.
In the U.S., the National Oceanic and Atmospheric Administration (NOAA) and the Centers for Disease Control (CDC) have given different answers to the "heat vs. cold" question. HERE is a website from Weather Underground (a commercial weather forecasting and reporting company) that summarizes some research and findings on this question. In any case, research generally shows a "V-shaped" weather-related mortality curve with a minimum at some optimum temperature for humans; that is, extreme cold or extreme hot weather compared to "norms" both cause increases in mortality.
An online search for "deaths from heat waves vs death from cold spells" will produce many sources of more information about this topic.
May, 2021: EPA Climate Change Indicators website
|
THIS WEBSITE from the Environmental Protection Agency contains a huge amount of graphed data
about changing weather and climate in the U.S. and around the globe. Here's just one such graph,
dealing with "heat wave" frequency in the U.S.
The data on the website have been provided from "more than 50 data contributors" and details about each underlying data set are available HERE. In response to a question I posed to the EPA about the recent history of this site, I got this response, from which you can reach your own conclusions: "The climate change website first went up in 2011. We have periodically updated it roughly once a year and upon releasing EPA Climate Change indicators reports (2012, 2014, 2016) – so the last website update was in 2016. While most other EPA climate change webpages were archived, the climate change indicators website remained live during the Trump administration; however, it was not updated. This latest website refresh (or relaunch) occurred in May 12, 2021 with the Biden Administration." |
 |
May 27, 2021: NY Times article about changes at fossil fuel companies
THIS NY TIMES ARTICLE summarizes some recent activities in fossil fuel companies. Large activist shareholders in Exxon, including BlackRock, the world's largest asset manager, have successfully backed changes in Exxon's board of directors, in opposition to that company's own nominations. BlackRock's chief executive has said that the coronavirus pandemic had "driven us to confront the global threat of climate change more forcefully."
One could argue that that pandemic doesn't have anything directly to do with climate change, but it's becoming clear that large shareholders in fossil fuel companies are increasingly aware of the extent to which continuing the current reliance on fossil fuels carries downsides not just for the environment, but also for shareholders. ANOTHER NY TIMES ARTICLE describes a court ruling in the Netherlands, requiring Royal Dutch Shell, Europe's largest oil company, to reduce the carbon dioxide emissions of its activities in the Netherlands by 45% compared to 2019 by the end of 2030.
(NY Times articles may not be viewable without a digital subscription to that paper.)
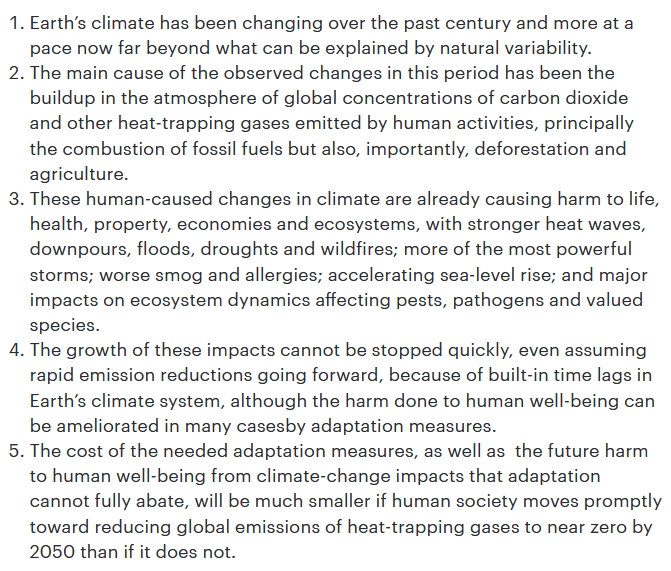
May 25, 2021, some climate science "takeaways" from John Holdren
This opinion piece found on The Hill's website (and other online sources) is by John P. Holdren, described as follows at the end of the piece:
John P. Holdren, Ph.D., is the Teresa and John Heinz professor of environmental policy in the Kennedy School of Government, professor of environmental science and policy in the Department of Earth and Planetary Sciences, and affiliated professor in the Environmental Science and Engineering Division of the John A. Paulson School of Engineering and Applied Science, all at Harvard University. From 2009 to 2017, he was the science advisor to President Obama and the Senate-confirmed director of the White House Office of Science and Technology Policy.
As it is by no means certain that links to this piece will be available in the future, here's a screen shot from the piece of "five key conclusions [about the current state of climate science] recognized by competent climate scientists around the world as true beyond any reasonable doubt." Of course, climate skeptics and deniers will dispute these conclusions. Although it is too often the case that commentators like to describe anyone who agrees with their positions as "prominent in their field," Dr. Holdren seems indisputably to fit such a description.
Losses from 2012 Hurricane Sandy due to rising sea levels
This May 21, 2021, article from the Philadelphia Inquirer summarizes results from a May 18, 2021, Open Access article published in the peer-reviewed journal Nature Communications. The article concludes that about $8.1 billion of the $62.7 billion losses in New Jersey, New York, and Connecticut attributed to the 2012 Superstorm Sandy can be linked directly to climate change-induced sea level rise. According to the article, a rise in sea level of about 4" in the last century forced coastal flooding farther inland, reaching 36,000 more homes than would have otherwise have been the case.
The article specifically explains that land subsidence along the eastern U.S. sea coast exacerbates the effects of global sea level rise, which in any case isn't uniform around the globe. This is important because climate change critics like to point out that the effects of land subsidence are too often ignored when talking about increased flooding risks due to the real effects of rising sea levels. It is, of course, possible to disagree with the authors' analysis. But, the facts that the work has been peer-reviewed and available for download at no charge serves to promote high-quality climate science research.
Opinion Piece, May 14, 2021: "Ignoring Climate change hasn't made it go away"
This NY Times opinion piece about "ignoring climate change," is by Eugene Robinson, a well-known liberal columnist for this paper. It's up to readers to assess articles like this. Does it present an honest appraisal of the current situation or is it too "alarmist"? Some of what is stated as fact is more nuanced than that. For example, the relationship between a warming climate and oceans and hurricane frequency and intensity is complex and a topic of extensive research and modeling by climate scientists. Statements about apparent sea level rise are often not clear enough about the combined effects of actual rising sea levels and the ground-based effects of land subsidence that's well-documented especially along the U.S. east coast.
Nonetheless, I find this opinion piece to be a mostly straightforward and fair summary of some negative anthropogenic influences on Earth's climate, overwhelmingly accepted in general by the Earth science community. The basic "political" message of the piece (Mr. Robinson is a political commentator and not a scientist of any kind) is that the Biden administration is letting science agencies do their jobs to deal with the consequences of a changing global climate instead of populating those agencies with political hacks and sidelining or removing anyone who tries to deal with reality.
Small modular (nuclear) reactors (SMRs):
In the debate about how to move toward a fossil fuel-independent energy future, the pros and cons of nuclear reactors play an important role. There's a vigorous ongoing debate about whether nuclear reactors should be included in a mix of renewable energy sources. Current reactor designs are incredibly expensive to build and have not solved the problems of long-term waste product storage and operational modes that can lead to catastrophic failures. What to do?
One promising new technology involves "inherently safe" designs for small reactors. These so-called "small modular reactors" (SMRs) are intended to produce powers at least an order of magnitude smaller than conventional reactors. In principle, they can be "factory produced" at much lower cost than current very large reactors. They could then be used in relatively large numbers to "decentralize" the power grid, which may increase security for our energy infrastructure. Another important scenario is that SMRs could be used as the "baseload" power sources that are required when dealing with intermittent power sources that depend on renewable sources like wind and sun. Quickly available baseload power generators are required to stabilize any power grid that includes variable sources.
Here are two online articles and a youtube video that present some facts, pro and con, about the future of SMRs. You can find many other online sources for information on this topic.
International Atomic Energy Agency (IAEA)
Energy Working Group
YouTube video
EPA webpage about airborne particulates:
This webpage provides information and links about the "Health and Environmental Effects of Particulate Matter (PM)." Airborne particulates can have serious health consequences, especially in minority and under-served communities where residents are too-often exposed to higher particulate concentrations and other environmental pollutants than other communities. IESRE has devoted considerable time to developing Arduino-based particulate sensors. See HERE, HERE, and HERE.
James Hansen article, May 13, 2021:
This article discusses global temperature anomalies observed during April 2021. For many years, James Hansen has been a prominent voice arguing for more urgent action to reduce anthropogenic impacts on Earth's climate and global warming. Some people, not restricted just to climate change skeptics and deniers, believe that his views are too alarmist and extreme. However, his academic and professional climate science credentials, backed up by a very large number of articles in peer-reviewed mournals, makes it impossible to dismiss his views out-of-hand. You can find more from Dr. Hansen on his website HERE.
NY Times article, May 13, 2021:
This article discusses the newly released 3o-year climate normals from NOAA. See also the the discussion of the May 4 Washington Post article on the same topic.
Washington Post article, May 5, 2021:
This article discusses studies presented recently in the highly respected peer-reviewed journal Nature. (Nature's articles aren't available online without an expensive subscription to the journal. Larger libraries may have the print version.) These studies show how limiting global warming may alleviate potentially large sea level rise from melting ice sheets in Antarctica. They also show how complicated this issue is for climate scientists. The studies are based primarily on models and simulations, rather than in situ observations, although there have also been recent data collection efforts around the Antarctic glacier/sea interface that are a cause for concern. Climate science skeptics and deniers like to criticize model simulations as too likely to offer, to what they perceive as a gullible public, "doomsday" scenarios that have no relationship to reality. However it's important to note that model simulations can both under- and over-predict negative outcomes for the future.
Washington Post article, May 4, 2021:
NOAA unveils new U.S. climate 'normals' that are warmer than ever.
"Climate Normals" are 30-year mean values for weather data such as air temperature. The new climate normals are based on the 30-year period from 1991 to 2020, which can be compared with normals from previous 30-year periods. The lead for this NOAA effort, Michael Palecki, has also been the lead on NOAA's Climate Reference Network, a national network of weather stations in places where conditions have been, and will remain, protected from manmade alterations of the local conditions around the stations.
The Washington Post article is based on data found HERE and HERE. It's important to understand that changes in 30-year normals are not necessarily an indicator of "climate change" – see the cited NOAA websites for more information. NOAA's Climate Reference Network (see HERE) is designed to use stable sites and consistent instrumentation to eliminate the observational complications from using the much larger network of weather stations, with sometimes questionable site locations and quality controls, upon which the climate normals are based.
April 2021: NASA site about global temperature anomalies
HERE is a link to a NASA site about global temperatures.
April 2021: Winter temperatures in the European Alps
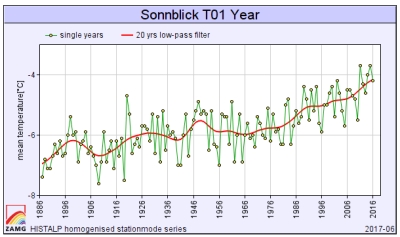
HERE is an example of a misleading posting on the wattsupwiththat.com website. It links to a video by a "ski researcher" discussing the fact that winter temperatures have not increased very much in the European alps in recent decades. The headline for the video link is "Alps Winter Warming "Not Significant"..."Astonishing Contrast Between Official Measurements and Public Opinion" in big bold type. But the "public opinion" to which the the headline refers is specifically just those people who might be concerned about ski conditions – the video presenter says as much. So, it is very misleading to imply that there is some general "public" astonished by these observations. And more importantly, text in the video states that "This data analysis is not suitable for questioning current global climate change" science that predicts and observes global warming and significant regional warming in some locations. Also, it is not even necessarily true that the small rise in winter temperatures over several decades is actually insignificant based on standard mathematical definitions of statistical significance.
All the data sources used in the video are specified. Here is a graph of yearly mean temperatures downloaded from Sonnblick Observatory high in the Autrian Alps. These data show a significant temperature increase following the start of the Industrial Revolution, at a site that has not been influenced by development and other anthropogenic actions that can sometimes introduce a "warm bias" into air temperature measurements.