© 2018, David Brooks, Institute for Earth Science Research and Education

An Arduino-Based System for Measuring Airborne Particle Concentrations

Introduction

      Airborne particulate matter (PM) is a widely recognized air quality problem. (See, for example, this U. S. Environmenteal Protection Agency (EPA) Site.) Airborne particulates fall into three categories, for which you can find many online sources of more information:       The health hazards from inhaling small particulates, and their wide distribution, explains why the EPA includes PM2.5 and PM10 particulates as components in the Air Quality Index (AQI). The AQI is widely reported for places around our country and around the world (with different standards in different counties). The U.S. standard is based on five pollutants – PM2.5 and PM10 particulates, ozone, sulfur dioxide, and nitrogen dioxide. (See EPA's Air Quality Index Basics.)
      Particulate pollution can cause and exacerbate existing respitory problems like asthma, and can create the hazy conditions that reduce visibility over large areas around the globe. The EPA designates areas as either meeting or not meeting PM and other air quality standards. To find local AQI data and forecasts, look at the map HERE and click on your location to see a list of nearby sites.
      The AQI is calculated based on the pollution component that reports the highest value on the AQI scale. This scale is designed to give pollutants with the same AQI value roughly the same health risk value as determined by the EPA and others. An explanation of how to convert PM2.5 and PM10 concentrations to their corresponding AQI values is given at the end of this document. EPA has an ONLINE CALCULATOR for converting any of the index pollutant concentrations to their AQI value, or the other way around.
      Often, but not always, PM values drive reported AQI values because particulate pollution is very common. Natural sources include volcanoes, dust storms, forest and grassland fires, volatile organic gases (terpenes) released from trees, and wind-driven sea spray. Human activities primarily involve the burning of fossil fuels in vehicles and power plants, industrial processes, and some agricultural processes. (See HERE.) Especially during the summer in urbanized areas, ozone often replaces PM as the pollutant driving the AQI. Your state may provide links to data that includes measured concentrations for all the AQI components; this is where you would look if you want to compare your PM readings with readings from an "official" site. For example, THIS SITE gives pollutant data for many stations in Pennsylvania.

Measuring Airborne Particulates

      One way to measure PM concentrations is to shine a laser beam across a chamber through which air is flowing. When the beam strikes airborne particles, a portion of the beam is diverted by an amount proportional to the size and density of the particles. One or more detectors measure the amount of light received from the laser beam at different angles from the undiverted original direction of the beam and those values can be used to determine the density of particles within a certain size range.
      This is only an approximate measurement method. It does not take into account effects that may be due to the actual shape of the particles encountered in the chamber – it is a very rough approximation to assume that the particles are spherical. Moisture in the air that coalesces around particles can affect the results. Nonetheless, laser based PM sensors are widely accepted as a standard method for measuring airborne particle concentrations.
      Professional laser-based PM counters are very expensive. Fortunately, there are some inexpensive laser-based sensors that do a reasonable job of monitoring particulates. Plantower's PM2.5 Air Quality Sensor with a connecting cable and breakout board with pins on 0.1" sensors (for connecting to breadboards) is available from Adafruit for $40. This same sensor is available from other sources for a few dollars less, but as is typical with Adafruit products, their version is "ready to go" with cables and documentation for interfacing with an Arduino microcontroller.
      Hookup is simple. The Plantower sensor requires only three connections – +5V power, ground, and digital pin 2 (set as a "software serial" input pin) from the sensor's transmit (TX) output. The sensor automatically sends data every second. Extracting values from the data stream isn't a job for casual programmers, but Adafruit provides sample code. If you are logging data, saving data every second is probably not a practical approach! In my code, I have averaged 100 samples and saved that average with a date/time stamp.
      My hardware setup is shown in the image below. I added a DHT22 temperature/relative humidity sensor (with its output connected to digital pin 8) because, as noted above, PM values can be affected by atmospheric conditions. (Although I am recording the temperature and relative humidity values, I have not figured out what to do with them in terms of adjusting the PM values.) The Arduino UNO setup includes an Adafruit datalogging shield with its clock and SD interfaces to record data with a date/time stamp. If you can afford it, it is well worth building two identical systems. Some of these components are available from other sources, but these are reliable US-based online sources I use regularly. Prices are approximate as of summer, 2018, and do not include shipping.

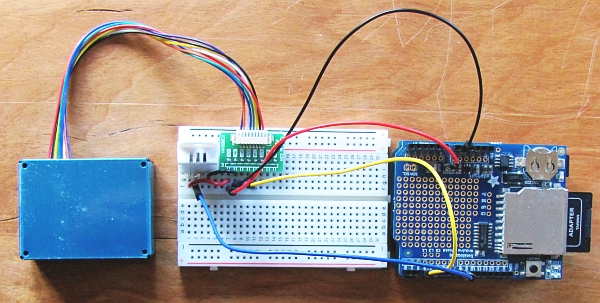
Components for Plantower PM monitoring system
Componentsource
Plantower PMS5003 particulate sensor www.adafruit.com, ID 3686, $40
      (includes cable and breakout board for breadboard)
Arduino UNO or compatible (various sources) www.adafruit.com, METRO 328, ID 2488, $18,
      plus A/Micro-B USB cable, ID 898, $3
www.allelectronics.com, UNO R3, ARD-21, $14
      (includes USB A/B cable)
www.allelectronics.com, SparkFun RedBoard, ARD-22, $20,
      plus A/Mini-B USB cable, CB-422, $2.25
DHT temperature/relative humidity sensor with
      10 kΩ pull-up resistor
www.allelectronics.com, ID 385, $10
data logging shield www.adafruit.com, ID 1141, $14,
      plus CR1220 coin cell battery, ID 380, $1
mini (170 contacts) breadboard www.allelectronics.com, PB-170, $2.50
assorted M/M jumper wires www.allelectronics.com, JMM6-10, $2
SD card or micro SD card with adapter www.allelectronics.com, MSD-8, $6.25, SDR-6, $1.25
(Any SD or micro SD card with standard SD card adapter will do.)


      This graph shows some PM, temperature, and relative humidity data collected on some hot and hazy September days on a screened porch at the back of my house.

Calculating the AQI for PM2.5 and PM10

      If you want to compare your PM data with published AQI data, you need to know how to convert PM concentrations to their corresponding AQI values. The EPA defines the method for calculating AQI from concentration measurements of all of its components. A series of quations define a piecewise linear function for each component, with breakpoints corresponding to air quality levels ranging from good to hazardous. Each AQI range is assigned its own color code ranging from green for good conditions to maroon for hazardous conditions.


      PM2.5 and PM10 are both components of the AQI. This table gives the upper concentration limits for 24-hour averages of PM2.5 and PM10, in units of µg/m3, to fall within certain air quality condition limits. (See, for example, THIS LINK.)

AQI conditionPM2.5PM10
Good12.054
Moderate35.4154
Unhealthy for sensitive groups55.4254
Unhealthy150.4354
Very Unhealthy 250.4424
Hazardous 350.4504
(Very) Hazardous 500.4604

      The fact that these concentration-to-index functions aren't straight lines reflects ongoing reassessment of the health risks associated with particular concentrations, especially at the low end of the concentration scale; this is particularly evident in the PM2.5 graph, where the concentration to reach an unhealthy situation has basically been cut in half from previous versions, from ~100 to ~50 µg/m3.
      Consider this example:

PM2.5 = 40 µg/m3
Index = (150 – 100)/(55.4 – 35.4)•(40 – 35.4) + 100 = 112 (rounded to nearest integer)

This is an "Unhealthy for Sensitive groups" index value that in many situations would define the AQI; it is not an uncommon particulate value to reach in many parts of the country, especially during the summer.

Arduino Code for PM Monitor and DHT22 Data

      This code was written for an Arduino UNO or compatible, using the freeware Arduino Integrated Development Environment (IDE). (See THIS LINK.) The code for accessing the data stream from the Plantower sensor is taken directly from the sample code provided in Adafruit's documentation for that device.
/* plantower_DHT22_log_2, D. Brooks, March 2018
  Averages 100 sets of PM data sent from Plantower.
  Reads T/RH from DHT22 and saves data to SD
  card with a date/time stamp.  
*/
#define KNT_MAX 100 // average this many samples
#include <SoftwareSerial.h>
SoftwareSerial pmsSerial(2, 3);
#include <DHT.h>
#define DHTPIN 8
#define DHTTYPE DHT22
DHT dht(DHTPIN,DHTTYPE);
#include <Wire.h>
#include <SD.h>
#define SDpin 10
#include <SPI.h>
#include <RTClib.h>
RTC_DS1307 rtc; // old data logger shield
//RTC_PCF8523 rtc;  // new data logger shield (different clock module)
int knt=0;
int yr,mon,dy,hr,minute,sec;
float pm1=0,pm25=0,pm10=0;
File logfile;
void setup() {
  Wire.begin(); rtc.begin(); Serial.begin(9600);
  pmsSerial.begin(9600);
  Serial.print(F("Initializing SD card..."));
  pinMode(SDpin,OUTPUT);
  if (!SD.begin(SDpin)) {Serial.println(F("Card failed.")); 
  delay(50);exit(0);}
  Serial.println(F("card initialized."));  
  logfile=SD.open("PM25_DHT.CSV",FILE_WRITE);
}
struct pms5003data {
uint16_t framelen;
uint16_t pm10_standard, pm25_standard, pm100_standard;
// use "environmental" data, not "standard"
uint16_t pm10_env, pm25_env, pm100_env;
uint16_t particles_03um, particles_05um, particles_10um, particles_25um, particles_50um, particles_100um;
uint16_t unused;
uint16_t checksum;
};
struct pms5003data data;
void loop() {
  if (readPMSdata(&pmsSerial)) { // reading data was successful!
    pm1+=data.pm10_env; pm25+=data.pm25_env;
    pm10+=data.pm100_env;
    knt++;
    if (knt==KNT_MAX) {
      DateTime now=rtc.now();
      yr=now.year(); mon=now.month(); dy=now.day();
      hr=now.hour(); minute=now.minute(); sec=now.second();   
      pm1/=knt; pm25/=knt; pm10/=knt;  
	  // store data in buffer
      logfile.print(yr);     logfile.print(',');
      logfile.print(mon);    logfile.print(',');
      logfile.print(dy);     logfile.print(',');
      logfile.print(hr);     logfile.print(',');
      logfile.print(minute); logfile.print(',');
      logfile.print(sec);    logfile.print(',');
	  // day as decimal fraction
      logfile.print(dy+hr/24.+minute/1440.+sec/86400.,5);
      logfile.print(',');
      logfile.print(pm1,1);  logfile.print(',');
      logfile.print(pm25,1); logfile.print(',');
      logfile.print(pm10,1); logfile.print(',');
      logfile.print(dht.readTemperature(),1);logfile.print(',');
      logfile.println(dht.readHumidity(),1);   
      logfile.flush(); // write from buffer to SD card
      pm1=0; pm25=0; pm10=0; // reset PM totals
      knt=0;                 // reset counter
    } 
  }
}
boolean readPMSdata(Stream *s) {
if (! s->available()) {
return false;
}
// Read a byte at a time until we get to the special '0x42' start-byte
if (s->peek() != 0x42) {
s->read();
return false;
}
// Now read all 32 bytes
if (s->available() < 32) {
return false;
}
uint8_t buffer[32];
uint16_t sum = 0;
s->readBytes(buffer, 32);
// get checksum ready
for (uint8_t i=0; i<30; i++) {
sum += buffer[i];
}
/* debugging
for (uint8_t i=2; i<32; i++) {
Serial.print("0x"); Serial.print(buffer[i], HEX); Serial.print(", ");
}
Serial.println();
*/
// The data comes in endian'd, this solves it so it works on all platforms
uint16_t buffer_u16[15];
for (uint8_t i=0; i<15; i++) {
buffer_u16[i] = buffer[2 + i*2 + 1];
buffer_u16[i] += (buffer[2 + i*2] << 8);
}
// put it into a nice struct :)
memcpy((void *)&data, (void *)buffer_u16, 30);
if (sum != data.checksum) {
Serial.println("Checksum failure");
return false;
}
// success!
return true;
}