Table 3. Sky color and clarity
| Scale Value | Sky Color | Sky Clarity
|
|---|
| 1 | Deep blue | Unusually clear
|
| 2 | Medium blue | Clear
|
| 3 | Light blue | Somewhat hazy
|
| 4 | Pale blue | Hazy
|
| 5 | Milky | Very hazy
|
With practice, however, you can learn to be consistent about your own interpretations. For
example, you can easily learn to recognize the deep blue clear sky that is associated with clean
skies and low relative humidity. With higher humidity and increasing aerosols, the sky color changes
to a lighter blue. It may appear milky rather than clear. In some places, especially in and near urban
areas, the sky can have a brownish or yellowish tint due to air pollution (primarily particulates and
NO2).
To determine sky color, look at the sky in a direction away from the sun, as shown in Figure
11. That is, you should be looking out over your shadow. Sky color is generally lighter near the
horizon. For this reason, you should be consistent about observing the sky at an elevation angle
of about 45º above the horizon. If this part of the sky is cloudy, use the nearest part of
the sky for which you can determine the color.
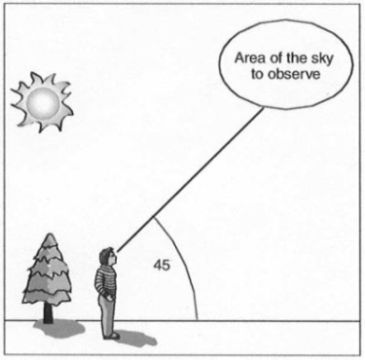 |
| Figure 11. Observing sky color. |
You can determine sky haziness by using a distant object – a tall building or mountain range,
for example – as a reference. When this object appears sharply defined in its natural colors, then
the sky is clear. As the object becomes less distinct, then there is probably more water vapor and
particles in the atmosphere. Note that this method of determining haziness is related to horizontal
visibility, which may not always be an accurate indicator of the condition of the atmosphere above
your site.
When there are obvious reasons for unusual sky conditions, you need to report them. Air pollution,
dust, and smoke are examples of conditions that need to be reported in the “comments” section.
Data Collection (back to the Table of Contencts)
In the Classroom (back to the Table of Contents)
The water vapor instrument should be at room temperature – about 20-25ºC – before
collecting data. In hot or cold weather, place the instrument in an insulated container before
you take it outside.
Make sure you have all required materials and that, if you are working as a team, each team
member understands her/his role. This is especially important if several different students
participate in these measurements on a rotating basis.
You can practice data collection in your classroom by pointing your instrument at
the sun through a window – even a closed window. If you can open a classroom window and
see the sun, you can collect actual data from your classroom, too.
In the Field (Manual Data Collection)
(back to the Table of Contents)
It is easier for two people to collect these data than for one person working alone. If you
are not familiar with this protocol, divide up the tasks and go through several practice runs
outside before you start recording real data with your water vapor instrument. Remember that
these practice runs may result in your instrument being exposed for a relatively long time to
hot or cold weather. Before you make “real” measurements, you must be sure your instrument has
returned to room temperature, as described in item 3 in the Metadata section of
Getting Ready to Take Measurements.
The steps described below may seem complicated at first. However, you can master them with only
a little experience in the field.
1. Turn your instrument on.
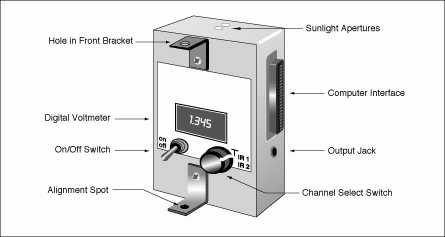
2. Hold the instrument in front of you in a position where you can read the digital panel meter
and can comfortably keep the sun spot shining through the front alignment bracket aligned on the rear
alignment dot.
It is helpful to be able to brace the instrument against your knees, a chair back, railing,
or some other fixed object.
3. Set the rotary switch to T and record the voltage.
This reading is related to the air temperature near the detectors in your instrument.
Record the voltage times 100. For example, a reading of 0.224 V should be recorded as
22.4ºC.
4. Set the rotary switch to IR1.
The Data Entry Form asks for measurements in IR1/IR2 order. You should develop the habit of
always making measurements in this order.
5. Adjust the pointing of your instrument until the spot of sunlight coming through the front
alignment bracket so that it is centered on the colored alignment spot on the rear bracket.
During the next 10-15 seconds, observe the voltage displayed on the panel meter,
WHILE KEEPING THE SPOT OF SUNLIGHT CENTERED OVER THE ALIGNMENT DOT, and record the maximum
voltage in the “sunlight voltage” column of your Water Vapor Data Sheet.
The voltages will fluctuate by a few millivolts even when you hold your instrument perfectly steady.
This is due to real fluctuations in the atmosphere. Do not try to “average” these fluctuating voltages.
Be sure to record all the digits displayed on the panel meter: 1.732 rather than 1.73, for example.
6. Record the time at which you made the measurement as accurately and precisely as possible.
An accuracy of 15-30 seconds is required. This is possible even with an analog watch that
has been set to a reliable standard.
7. While still pointing your instrument at the sun, cover the sunlight apertures
with your finger to block all light from entering the case. Record this reading in the
“dark voltage” column on the Water Vapor Data Sheet.
After you are familiar with your instrument, you do not need to actually observe the
dark voltage every time you take a measurement, as it should not change. It the dark voltage
does change significantly, it means your instrument is much too hot or too cold.
8. Select the IR2 channel and repeat steps 5-7.
Measurements should always be reported as IR1/IR2 pairs.
9. Repeat steps 4-8 between two and four more times.
This will give three to five pairs of IR1/IR2 measurements. Remember that it is important
to be consistent about the order in which you collect these data: IR1/IR2/IR1/IR2/IR1/IR2...
The time between measurements is not critical as long as you record the time accurately. However,
especially in hot or cold weather, it is important to minimize the total measurement time, in
order to minimize temperature fluctuations inside your instrument case. A set of from three to
five pairs of measurements should not take longer than two or three minutes (20-30 seconds per
voltage value).
10. Set the rotary switch to T and record the temperature. Then turn off your water
vapor instrument.
11. If you are using actual outdoor measurements for air temperature and relative humidity,
make these measurements now.
Automated Data Collection with a Computer
(back to the Table of Contents)
The only difference between the manual and automated protocols concerns how the water
vapor instrument is used. The metadata reporting requirements are exactly the same. A brief
introduction to using data logging hardware and software is given in Section 3.
Additional Classroom Preparation for Automated
Data Collection (back to the Table of Contents)
In addition to the general In the Classroom instructions given above, additional steps
are required to prepare the data logging software.
1. Connect the computer interface to the 25-pin plug on your instrument. Connect the interface
to your laptop's serial port, using the appropriate cable (typically the cable will have a db25 male
connector on one end and a db9 female connector on the other end).
2. Start the data logging software. Go through all the setup steps, just until the
point where you tell the software to start sampling data. It is important to select a meaningful
file name in which to store the data. For example, wv091803 could be the name of a file that
contains data collected on September 18, 2003.
In the Field (Automated Data Collection)
(back to the Table of Contents)
1. Hold the instrument in front of you in a position where you can read the digital panel
meter and can comfortably keep the sun spot shining through the front alignment bracket aligned
on the rear alignment dot.
It is helpful to be able to brace the instrument against your knees, a chair back,
railing, or some other fixed object.
2. Turn on your instrument and activate the data logging software.
The position of the rotary switch does not matter, as all three channels (IR1, IR2, and T)
are always recorded simultaneously. It may be helpful to use the "T" position so you can monitor
the temperature inside your instrument's case.
If you activate the data collection software before turning on your instrument,
you may see voltage spikes in your data file. These will not affect the quality of
your data, but they can be annoying when you are trying to interpret those data.
3. Cover the sunlight apertures with your finger for about 3-5 seconds while
the instrument is pointed approximately at the sun.
This provides a brief dark voltage sample.
4. Center the sunlight spot coming through the hole in the front bracket on the
circular dot on the rear bracket and remove your finger from the sunlight apertures. Hold
your instrument in this position for two minutes.
It is important to keep the sun spot centered over the dot on the rear bracket
and to hold this position as steadily as possible. You may have to adjust the pointing
of your instrument slightly to keep it centered as the sun moves across the sky.
5. At the end of two minutes, cover the sunlight apertures with your finger and hold
this position for about 3-5 seconds.
6. Stop the logging software and turn off your water vapor instrument.
If you turn off the instrument first, you may see voltage spikes in your data file.
7. If you are using actual outdoor measurements for air temperature and relative humidity, make
these measurements now.
When You Return To the Classroom
(Manual or Automated Data Collection) (back to the Table of Contents)
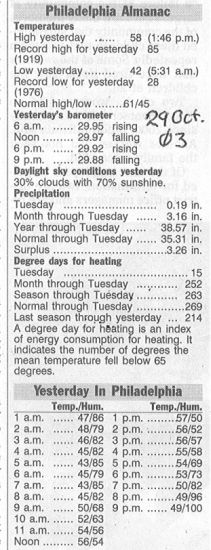
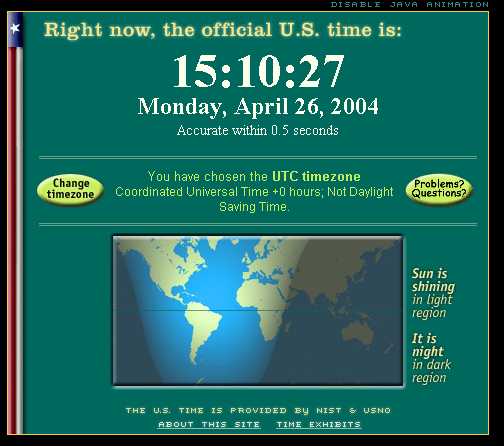
If you have a classroom barometer, read it now. If you are using online sources for
meteorological information, as described above, do that now. If you cannot conveniently
access a computer right before or after your measurements, you may still be able to get
meteorological information the following day, using weather almanacs published in some
newspapers. Remember that the purpose for reporting these meteorological values is to help
scientists interpret your data. Your goal should always be to report values that accurately
represent conditions at the time and location where the measurements were made.
Complete the Water Vapor Data Sheet. If you are using automated data collection, record the
name of the file in which your results are stored. Be sure that the date on the sheet is the
date on which the measurements were actually made. Include the names of the individual(s) making
the measurement. Store the original data sheet in a notebook reserved just for this purpose.
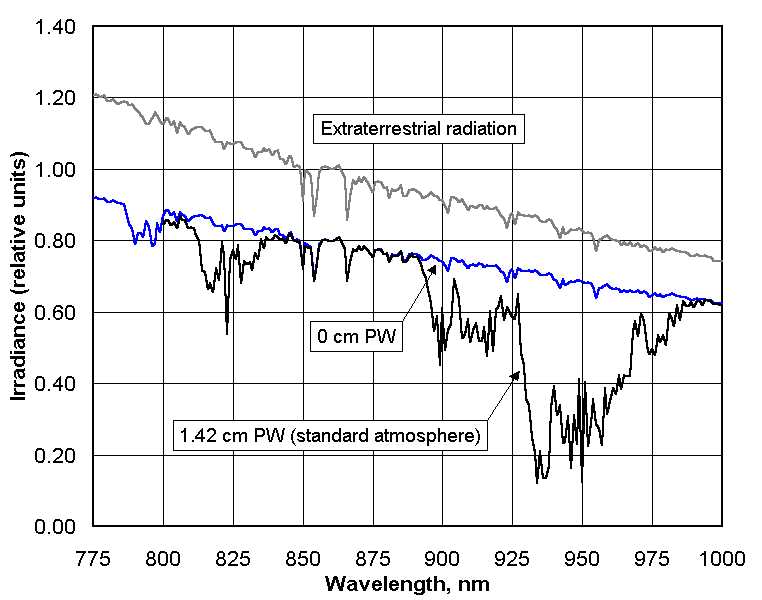
1. What does the GLOBE/GIFTS water vapor instrument measure?
This instrument takes advantage of the fact that water vapor molecules in the atmosphere
absorb sunlight that would otherwise reach Earth’s surface. The instrument has two detectors
that respond to radiation in the near-infrared part of the solar spectrum. One of these detectors
overlaps a major water vapor absorption band and one is outside this band. What the instrument
measures directly is the amplified current (in the form of a voltage output from two amplifiers)
from each of these detectors. When the instrument is properly calibrated, the ratio of the output
voltages from the two channels can be related to the amount of water vapor in the atmosphere.
2. The GLOBE/GIFTS water vapor instrument uses a light-emitting diode (LED) as one of its sunlight
detectors. What is an LED?
A light-emitting diode is a semiconductor device that emits light when an electrical current
flows through it. The actual device is a tiny chip only a fraction of a millimeter in diameter. The
chip is housed in either a small metal case with a flat glass cover about 5 mm in diameter, or an epoxy
cylinder about 5 mm in diameter.
The physical process that causes LEDs to emit light also works the other way around: if light
shines on an LED, it produces a very small electrical current. The electronics in your water vapor
instrument amplify this current and convert it to a voltage.
LEDs are found in a wide range of electronic instruments and consumer products. The most familiar
LEDs emit visible light – red, yellow, green, or blue. The LED in your water vapor instrument emits
(and responds to) infrared light. This radiation is invisible to the human eye. Infrared LED
transmitters and detectors are commonly used in the familiar handheld remote control devices included
with consumer electronics devices such as TVs and audio equipment.
The other detector in the GLOBE/GIFTS instrument is a photodiode with a built-in filter.
This is a broadband detector whose response is limited by a piece of coated glass placed over
the detector. The coated glass is called an interference filter. Some versions of the GLOBE/GIFTS
water instrument may use two filtered photodiodes, with no LED.
3. What is the field of view of the GLOBE/GIFTS water vapor instrument and why is it important?
The water vapor instrument is a specialized application of what is generally known as a sun photometer.
The equation that describes theoretically how to interpret sun photometer measurements requires that
the instrument should see only direct light from the sun – that is, light that follows a straight-line
path from the sun to the light detector. This requirement can be met only approximately because all sun photometers will see some scattered light and
direct light from the sky around the sun.
The cone of light a sun photometer’s detector sees is called its field of view, and it is desirable to
have this cone as narrow as possible. The GLOBE water vapor instrument’s field of view is about 2.5°,
which is a reasonable compromise between desires for accuracy and practical considerations in building
a handheld instrument. The basic tradeoff is that the smaller the field of view, the harder the
instrument is to point accurately at the sun. Very expensive sun photometers, with motors and
electronics to align the detector with the sun, can have fields of view of 1° or less. Studies have
shown that the error introduced by somewhat larger fields of view is negligible for the conditions
under which a GLOBE sun photometer should be used. Scattered light is even less of a problem for the
infrared wavelengths used in the GLOBE/GIFTS water vapor instrument.
4. How important is it to keep the water vapor instrument from getting hot or cold while I'm taking
measurements?
The detectors in your instrument are temperature-sensitive, so their output is slightly influenced
by their temperature. Therefore, it is very important to protect your instrument from getting too hot
in the summer or too cold in the winter. If you follow the suggestions given here and take your
measurements as quickly as possible once you're outside, then you can minimize undesirable temperature
effects.
In the summer, it is essential to keep your instrument case out of direct sunlight when you are not
actually taking a measurement. In the winter, it is essential to keep the instrument warm - you can
tuck it under your coat between measurements. Also, you can transport your instrument to and from the
observing sight in an insulated container such as a small picnic cooler. Never leave your instrument
outside or in any other extreme temperature environment for extended periods of time.
The instrument case itself provides some protection from temperature changes that can affect the
electronics inside. In extreme conditions (winter or summer), you should consider making an insulating
housing for your instrument, using Styrofoam or other rigid foam plastic. Cut holes for the on/off
switch, panel meter, and sunlight aperture, and a channel for sunlight to pass from the front alignment
bracket to the target on the back bracket. The hole for the sunlight aperture should be no smaller in
diameter than the thickness of the insulating material itself, and in no case should it be smaller
than about 1 cm.
The "T" switch position on the top of your water vapor instrument monitors temperature inside
the case. The temperature in degrees C is 100 times the voltage displayed on the panel meter.
5. I dropped my water vapor instrument. What should I do now?
Fortunately, the components inside your sun photometer are virtually indestructible, so they
should survive being dropped. If you have made an insulated housing for your instrument, as suggested
in the previous question, then it will be well protected. Check the case for cracks. Even if the case
is cracked, it may still be OK. Just tape over the cracks using something opaque, such as duct tape or
aluminum tape. Open the case and make sure that everything looks OK. In particular, make sure that the
battery is still firmly attached to its connector.
Check the alignment of the sunlight spot on the colored dot on the rear alignment bracket.
The maximum voltage should be displayed when the sunlight spot is centered around this dot. If
this is not true, or if the alignment brackets have obviously moved or are loose as a result of
the fall, your instrument should be returned to Langley Research Center or the primary author of
this report for recalibration.
6. How do I know if my water vapor instrument is working properly?
When you turn your water vapor instrument on without pointing it at the sun, you should
measure a small DC voltage no larger than a few millivolts. When you point your instrument
directly at the sun, the voltage should increase to a value in the range of about 0.5 to 2 V.
If you do not observe these kinds of voltage changes when you point your instrument at the sun,
then it is not working.
The most likely reason for a water vapor instrument to stop working is that the
battery is too weak to power the electronics. As indicated in the procedure for changing the
battery (see the GLOBE Aerosols Protocol), you should replace the battery if its voltage with
the instrument turned on is less than 7.5 V. You should check the battery three or four times per
year unless you know your instrument has inadvertently been left turned on for an extended period
of time. If the "low battery" indicator appears on the panel meter, replace the battery immediately.
Changing the battery will not affect the calibration of your instrument. If you replace the
battery and your instrument still appears not to work, contact the primary author of this report.
7. What does it mean to calibrate a water vapor instrument?
As noted in question 1, above, the water vapor instrument works by examining the ratio of the
response of two near-IR detectors - one inside and one outside a water vapor absorption band. A
practical calibration method is to establish an empirical relationship between this ratio and the
total precipitable water vapor measured in some other way. PW can be measured from the ground with
sun photometers, instrumented balloons, and various ground-based optical and microwave instruments.
A newer method makes use of the microwave signals from Global Positioning System (GPS) satellites.
Various methods are used to measure water vapor from satellite-based instruments, but these require
ground-based references for validation of the required calculations.
8. How often must I take water vapor measurements?
The protocol asks that you take measurements every day, weather permitting. In some parts
of the world, it is possible to go many days without having weather suitable for taking these
measurements. It is highly desirable to have a plan for taking measurements on weekends and during
holiday breaks (especially during extended summer holidays.) Occasionally, it is worth taking many
measurements during the day to study the diurnal cycle of water vapor.
9. How can I tell whether the sky is clear enough to take water vapor measurements?
The basic rule is that the sun must not be blocked by thick and/or variable clouds during a
measurement. It is OK to have clouds near the sun. Thin and uniform cirrus clouds are not a
problem as long as sunlight still makes a clear shadow and measurements for the two channels
are taken in quick succession.
It can be difficult to decide conditions around the sun, because you should never look directly at
the sun. You can look at the sky near the sun by blocking the sun with a book or notebook. An even
better idea is to use the corner of a building to block the sun. It is a good idea to wear sunglasses
when you make these decisions because they protect your eyes from UV radiation. Orange-tinted
sunglasses make cloud/sky boundaries more clear and they will help you see faint clouds that might
otherwise be invisible.
If you have concerns about a measurement, indicate them in your qualitative description of
sky conditions when you report the measurement. Thin cirrus clouds are notoriously difficult to
detect, but they can affect water vapor measurements. If you see cirrus clouds in the hours before
or after a measurement, be sure to include that in your comments.
Safety Reminder: Never look directly at the sun, even through colored sunglasses or
plastic filters. This can seriously damage your eyes!
10. What is water vapor?
Water vapor is simply water (H2O) in gaseous (molecular) form. Water vapor is unevenly
dispersed throughout the atmosphere around the earth. It is measured in terms of the thickness
of layer of water that would result if all water vapor in an imaginary column of atmosphere
directly above an observer were brought to Earth's surface and condensed into a liquid. Typically,
this amounts to a few centimeters of water. All but about 0.1 cm or so of PW is in the troposphere,
and most of the tropospheric PW is within a few kilometers of the surface.
11. How accurate are measurements made with the GLOBE water vapor instrument?
This is a difficult question whose answer is the subject of ongoing research. There is no
accepted reference standard against which GLOBE water vapor measurements can be compared. All
measurements of total atmospheric water vapor content are subject to errors and uncertainties.
Calibration of the GLOBE/GIFTS water vapor instrument depends on measurements made with other
techniques. Therefore, its accuracy depends on the accuracy of those techniques. Other
sun-photometer based measurements of water vapor do not claim accuracies better than about 10%.
Although this may seem like a large error, it is sufficient to be useful for improved understanding
of the distribution and transport of water vapor.
12. How is total precipitable water vapor related to atmospheric properties measurable
at the ground?
Practically by definition, it is not possible to infer total atmospheric precipitable water
vapor (PW) directly and accurately from other measurements made on the ground. If that were
possible, there would be no need for a water vapor instrument! However, atmospheric scientists
have long understood that there is an approximate relationship between PW and the surface dewpoint
temperature. More than 40 years ago, C. H. Reitan [Reitan, 1963] proposed an empirical relationship:
ln(PW) = -0.981 + 0.0341 ·Td,F
where ln(PW) is the natural logarithm of the column water vapor in centimeters
and Td,F is the dewpoint temperature in degrees Fahrenheit. For temperature expressed in degrees
Centigrade,
ln(PW) = -0 981 + 0.0341 ·(Td ·9/5 + 32)
or
ln(PW) = 0.1102 + 0.0614 ·Td
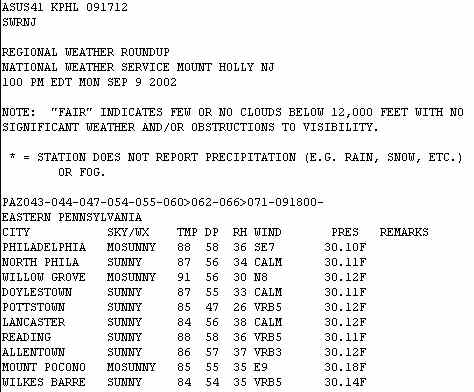
In the U.S., dewpoint temperature (in degrees Fahrenheit) is included in the hourly
meteorological reports at the National Weather Service weather site:
http://iwin.nws.noaa.gov/iwin/[two-letter state
code]/hourly.html. Equations for calculating dewpoint temperature from air temperature
and relative humidity are given in Section 4.
Because the relationship between PW and dewpoint temperature is only approximate, it cannot
substitute for an actual calibration of a water vapor instrument.
13. How is water vapor related to the hydrologic cycle?
Water vapor in the atmosphere is the result of the evaporation and transpiration phase of
the hydrologic cycle. For on-line introductions to the hydrologic cycle, see
http://observe.arc.nasa.gov/nasa
/earth/hydrocycle/hydro1.html
http://www.epa.gov/seahome/groundwater/src/cycle.htm#cycle
14. Will scientists really be interested in my water vapor measurements?
Yes. In many parts of the world, there are no ground-based sources of water vapor measurements.
Satellite-based measurements of water vapor are extremely important, but they depend on
ground-based measurements to ensure their accuracy and stability.
In temperate climates, the dominant feature of total precipitable water vapor (PW) is its
strong seasonal cycle. This can be seen in Figure 12, a 10-year record of PW measurements made
with an LED-based instrument similar to the GLOBE PW instrument by Forrest Mims, co-PI for the
GLOBE/GIFTS Water Vapor Project, at his observatory in Seguin, Texas, USA [Mims, 2002]. It is
clear from Figure 12 that PW values are higher in the summer than in the winter.
PW measurements made by students in temperate climates should exhibit this seasonal cycle.
Measurements made in other kinds of climates, such as tropical regions that have wet and dry seasons,
should have PW cycles that are related to these seasons. PW values at high-elevation observing sites
will be smaller than those for sites nearer to sea level. (Unlike barometric pressure, for example,
PW values are not usually normalized to sea level; they represent the actual amount of water vapor in
the atmosphere above the observing site.)
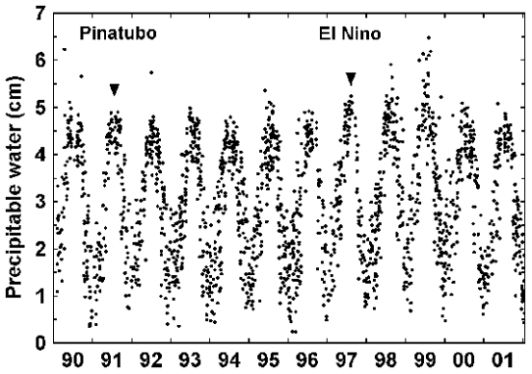 |
| Figure 12. 10-year record of water vapor in Seguin, Texas, USA. |
It might seem reasonable to expect PW to be related to relative humidity. However, the
correlation between the amount of water vapor in the entire atmosphere and relative humidity - a
measurement made near Earth's surface - is not particularly strong. However, under some conditions,
PW is related with another surface meteorological parameter: dewpoint temperature. This quantity,
calculated from relative humidity and air temperature, is the temperature close to Earth's surface
at which the relative humidity of the atmosphere would be 100%. (That is, when the relative
humidity is less than 100%, the dewpoint temperature is less than the air temperature.) Dewpoint
temperature is included along with air temperature and relative humidity in the hourly weather
updates on the National Weather Service web site:
http://iwin.nws.noaa.gov/iwin/[two-letter state
code]/hourly.html.
(Note that these NWS sites always give temperature in degrees Fahrenheit.)
Figure 13 shows water vapor as a function of dewpoint temperature. These data are from the
same set of measurements presented in Figure 12. There are various methods for calculating dewpoint
temperature from air temperature and relative humidity, none of which are particularly intuitive or
simple. See Section 4 for one widely used method. Recall that an empirical relationship between PW and
dewpoint temperature (Reitan's formula) was given in question 12 from Section 2.10. Note that Figure 13
shows PW versus dewpoint temperature, while Reitan's formula indicates that the logarithm of PW is a
linear function of dewpoint temperature.
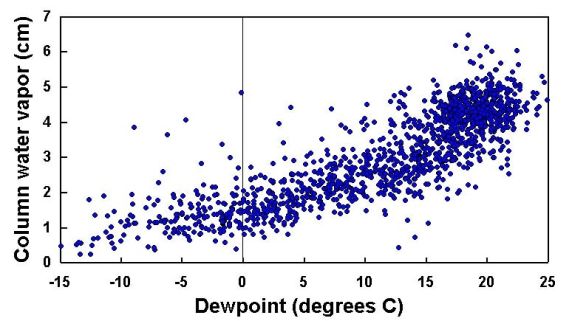 |
| Figure 13. Relationship of water vapor to dewpoint temperature. |
It would be an interesting student exercise to compare the data in Figure 13 to the
predictions of Reitan's formula. Although this relationship is interesting, clearly it cannot be
used as a primary calibration for a water vapor instrument. (If this were possible, there would be
no need for a water vapor instrument!) At its best, the correlation is not very good and the
relationship can break down when the weather is changing rapidly - when a cold front is passing, for
example.
3. Guide to Data Logger Hardware and Software
(back to the Table of Contents)
Your water vapor instrument is equipped with a standard 25-pin connector (a db25 plug). The
purpose of the plug is to connect the instrument to a portable computer, through a device that converts
the output voltages from the instrument to digital values that can be stored in your computer.
There are three sources of output voltages in your water vapor instrument: the two IR detector
channels (IR1 and IR2) and the output from a temperature sensor. When you use this instrument in the
manual mode, you can choose which of these three channels to display on the panel meter.
When you collect data through the hardware interface, all three voltage outputs are available
simultaneously. This is true regardless of which value is being displayed on the panel meter. The
advantage of this arrangement is that the calculations needed to interpret your data can be done
with measurements that are simultaneous, rather than one after the other, as is necessary in the
manual mode.
The db25 plug on the GLOBE/GIFTS water vapor instrument is intended for use with a particular
product - a 232SDA12 analog-to-digital converter manufactured by B&B Electronics. (See www.bb-elec.com)
This device must be connected to a Windows-based computer. It is possible to use other computer
interfaces, although these will require modifications of the connections to the db25 plug. If you
have questions, please contact the principal author of this report.
4. Calculating Dewpoint Temperature
(back to the Table of Contents)
Dewpoint temperature is defined as the temperature to which a parcel of air would need to
be cooled at constant pressure and constant moisture content in order for the vapor pressure
and saturation vapor pressure of the parcel to be equal. In other words, it is the temperature
at which a parcel of air would be saturated (i.e., 100% relative humidity). (See, for example,
Huschke, 1959.)
Precise calculations of dewpoint temperature are complicated, but a good approximation can be
obtained by using relative humidity and temperature to calculate vapor pressure and saturation
vapor pressure. The U.S.-government sponsored Advanced Weather Interactive Processing System
(AWIPS) includes equations for calculating dewpoint. (See http://199.26.34.19/AWIPS_home for more details.)
The AWIPS formulation for calculating saturation vapor pressure is:
Next, the relative humidity is used to calculate the vapor pressure. Vapor pressure is then used
in an empirical formula to calculate dewpoint temperature, expressed in Kelvins:
where:
T = temperature (K)
RH = relative humidity (ratio, 0-1)
b = intermediate place holder variable
C15 = 26.66082
C1 = 0.0091379024
C2 = 6106.396
C3 = 223.1986
C4 = 0.0182758048
Convert Kelvins to degrees Centigrade by subtracting 273.15.
5. Learning Activity: Measuring Dewpoint Temperature
(back to the Table of Contents)
Summary:
Use a glass of water, pieces of ice, and a thermometer to determine the dewpoint temperature.
Concepts:
The atmosphere contains water in its vapor form.
When air at a particular temperature becomes saturated with water vapor, some
of that vapor condenses into a liquid form when it is in contact with a
cooler surface.
Background for Classroom Discussion:
How do we know that the atmosphere contains water, in the form of water vapor? Reports of relative
humidity provide us with information about water vapor in the air. The higher the relative humidity,
the more moisture there is in the lower atmosphere. If you live in a temperate or tropical climate,
you know that hot weather is more uncomfortable when the relative humidity is high. The reason is that
the degree to which human skin can evaporate sweat (a process that has a cooling effect on the skin)
depends inversely on the relative humidity - the higher the relative humidity, the less evaporation
can take place.
We can get more direct evidence of moisture in the air whenever condensation occurs on a cool
surface in warm weather. The moisture that forms on a cold drink bottle comes not from the contents
of the bottle (hopefully!), but from moisture in the air.
Students may be reluctant to believe that water comes from the air, or perhaps they may be
unfamiliar with (or not accept) the concept that water vapor in the air is just liquid water in
another form. Therefore, it may be helpful to pose the question, "Where does this moisture come from?"
and let students arrive at a conclusion by eliminating other possibilities.
The transition from water vapor to liquid water takes place at a temperature determined by the
temperature of the air and the amount of water vapor in the air. These two parameters define the
dewpoint temperature - the temperature at which water vapor condenses on a surface. See the
discussion in Section 4 for details of how to calculate dewpoint temperature.
References:
Various versions of this experiment have been described in books and online sites that deal
with weather science. Two print sources are:
Mandell, Muriel (illustrated by Frances Zweifel): Simple Weather Experiments With Everyday
Materials. Sterling Publishing Company, NY, 1990. ISBN 0-8069-7296-3 (trade); 0-8069-7295-5
(paper, 1991).
VanCleave, Janice: Janice VanCleave's Weather: Mind-Boggling Experiments You Can
Turn Into Science Fair Projects. John Wiley & Sons, Inc., NY, 1995. ISBN 0-471-03231-X.
Measuring Dewpoint Temperature
Materials:
Clear plastic drinking cup (optional: aluminum beverage can)
Alcohol thermometer or digital thermometer with remote temperature sensing probe
Water
Pieces of ice (broken ice cubes or commercial cracked or shaved ice)
Procedure:
This experiment can be conducted inside or outside. If it is done outside, the air
temperature should be well above freezing.
1. Fill a dry clear plastic drinking cup approximately half full with tap water at room
temperature.
Be sure that water does not overflow or splash onto the outside surfaces of the cup.
Initially, the outside of the cup should be completely dry.
2. Place the thermometer in the cup so you can read the temperature without disturbing the
thermometer.
Wait for the temperature to stabilize. If the outside of the cup appears "frosty" or damp,
the water is already too cold. Try again with warmer water.
3. Gradually add ice, a few small pieces at a time. Stir gently with the
thermometer and wait for the temperature to stabilize.
4. Repeat step 3 until the outside of the cup just appears "frosty" or damp.
This will occur suddenly rather than gradually. Record the water temperature.
5. Compare this temperature with the dewpoint temperature at a nearby weather station.
You can find this value using an online source such as http://iwin.nws.noaa.gov/iwin/[two-letter state
code]/hourly.html. This comparison is valid only if the experiment is conducted outside.
Note that the National Weather Service gives temperatures in degrees Fahrenheit rather than
Centigrade (Celsius).
Interpretation:
The temperature at which moisture first appears on the outside surface of the cup should be very
close to the theoretically calculated dewpoint temperature.
The experiment assumes that the temperature on the outside surface of the cup is the same as
the temperature of the water inside the cup. The more gradually you add ice and stir the water/ice
mixture, the more accurate this assumption will be.
Discussion Questions:
1. When moisture forms on the outside of the ice/water container, where does the water come
from?
It comes from water vapor in the atmosphere. When the outer surface of the container
reaches the dewpoint temperature, the air in contact with this cool surface becomes saturated
with water vapor (that is, it reaches a relative humidity of 100%) and some of the water vapor
then condenses into a liquid state.
2. When the relative humidity decreases, what happens to the dewpoint temperature, assuming
the air temperature stays the same?
When relative humidity decreases, the dewpoint temperature also decreases.
3. Why do cold drink bottles appear "frosty" or damp on hot and humid days?
The dewpoint temperature is well above the temperature of a cold drink, so the outer surface
of the drink bottle will quickly fall below the dewpoint temperature, causing water vapor to
condense.
4. As an alternative to the plastic cup, you could use an aluminum drink can as a container.
If you do this experiment with both a plastic cup and an aluminum drink can, will the results be
different? Why or why not?
The results should be the same if the experiment is done carefully - especially if the
ice is added slowly. Metal conducts heat better than plastic, so the temperature of the outside
surface of the container should reach the temperature of the water/ice mixture more quickly.
However, it may not be possible to read a small thermometer without removing it from the water
in a metal container; this may introduce a temperature error.
5. How accurately do you think this experiment allows you to determine the dewpoint temperature?
The basic limitation on accuracy in this experiment is the accuracy of the thermometer itself,
typically 1 or 2 degrees Fahrenheit (1 degree Centigrade) or more for inexpensive digital or analog
thermometers. You can calibrate a thermometer by placing it in a beaker holding roughly equal amounts
of water and ice. The thermometer should read 32ºF or 0ºC. If the thermometer says something different,
the difference is the "offset" for the thermometer. You must then make the assumption that the same
offset applies to other temperatures readable with that thermometer.
If the experiment is done carefully, then the accuracy of the dewpoint temperature should be no
worse than the accuracy of the thermometer itself. If the temperature of the outside of the container
is not the same as that of the water/ice mixture, then the experimental error can be several degrees.
If you add ice too quickly, and do not stir the mixture thoroughly, then the water/ice mixture could
temporarily be colder than the outside of the container. This could lead you to underestimate the
dewpoint temperature.
There are various methods of calculating dewpoint temperature, as noted in Section 4.
Even approximate methods should agree within a few tenths of a degree.
6. How could a digital thermometer with a remote sensing probe help you to design a
better experiment?
It is easier to read this kind of thermometer. A remote sensor would be especially helpful
if you are using an aluminum beverage can to contain the water/ice mixture (because you can't see
inside the container). You will still need something with which to stir the water/ice mixture. Note
that even though a digital thermometer may display temperature to the nearest 0.1 degree, this does
not imply that the thermometer is actually accurate to the nearest tenth of a degree, either
Fahrenheit or Centigrade. In fact, typical classroom thermometers, whether analog or digital, will
be accurate to no better than roughly 0.5ºC or 1ºF.
7. Why does hot weather feel less uncomfortable when the relative humidity is low?
When the relative humidity is low, human skin can more efficiently evaporate sweat. It takes
energy to convert liquid water (sweat) into its vapor form. The expenditure of this energy, which
comes from your body heat, has a cooling effect on the skin.
8. When buildings are heated in the winter, the air can feel very dry. Why?
When air is heated without changing its absolute moisture content, the relative humidity
decreases. The relative humidity of winter air is typically lower than summer air, so heating
this air in an enclosed volume can produce very low values of relative humidity.
9. Why do heated rooms in the winter sometimes feel cold even when the air temperature is
set at what should be a comfortable level?
Because heated air can be very dry (see question 8), the evaporation of moisture from your
skin can make the air appear colder than it actually is. Heating systems often try to counteract
this effect by including a humidifier to add extra moisture to heated air.
10. Outside and inside dewpoint temperatures are usually different. Why?
When indoor air is heated in the winter or cooled in the winter, both the temperature and
the relative humidity are different from outside air. See questions 8 and 9 about heating buildings
in the winter. In the summer, "air conditioning" not only lowers air temperature, but it also removes
moisture from the air.
6. How Do Analog-To-Digital Converters
Work?(back to the Table of Contents)
It is sometimes a good idea to collect a time series of measurements with your water vapor
instrument. This is useful for checking the performance of the instrument, and can also be used
to examine the amount of "noise" in the water vapor signal itself. To do this, the output of the
instrument must be connected to an analog-to-digital (A/D) converter that transmits digital values
to a computer for storage and later retrieval. The GLOBE/GIFTS water vapor instrument includes an
output connector for this purpose.
When you collect data in this way, you will need to specify the interval at which the output voltages
are sampled by the A/D converter. Suppose this rate is one sample per second (a reasonable rate for
the water vapor instrument). This means that, once per second, the A/D converter samples the voltage
outputs and converts the values to equivalent digital values. This digital number is then transmitted
to a computer, where it can be converted back again into the corresponding analog value.
Why is this conversion necessary? When information is sent to your computer, it is sent in the form
of a series of on/off values called bits - that is, in a digital form. Any analog value, such as a
voltage, must be represented in this way.
How does an A/D converter represent analog values? First of all, the hardware expects to see analog
values in a specified range - from 0 to 5 V is typical. The converter assigns an analog value a
particular digital value. The available range of digital values depends on how many bits are used
to represent each analog value; this is called the resolution of the A/D conversion. A/D conversion
is often done at 8-bit and 12-bit resolution, depending on the application.
First, here's a quick introduction to binary arithmetic. Consider a representation consisting
of 8 on/off bits. Each bit represents a power of 2. The rightmost bit represents 20=1. The leftmost
bit represents 27=128. What range of integer values can be represented by these 8 bits? If all the
bits are 0's ("off"), then the corresponding integer value is 0. If all the bits are 1's ("on"),
then the corresponding integer value is:
27 + 26 + 25 + 24 + 23 + 22 + 21 + 20 =
128 + 64 + 32 + 16 + 8 + 4 + 2 + 1 = 255
Here are some examples:
11 = 23 + 21 + 20 = 8 + 2 + 1 --> 00001011
109 = 26 + 25 + 23 + 22 + 20 = 64 + 32 + 8 + 4 + 1 --> 001101101
When the 8-bit A/D converter sees an analog voltage between 0 and 5 V it assigns it an
integer value between 0 and 255, where 255 represents 5 V. Suppose the signal is 3.352 V. Then,
(3.352/5)·255=170.952. Ideally, this value will be rounded to 171 and it will be represented in
binary arithmetic as 10101011 (128+32+8+2+1). It is not always clear how A/D converters handle
rounding. So, it is possible that this value could be represented as 10101010. That is, the
conversion could be one bit off.
How accurately does an 8-bit conversion represent voltages? A 5 V signal can be represented as
one of 255 possible integer values. Hence, one "unit" is 5/255=0.0196 V. So, the resolution of an
8-bit conversion is about 20 mV. That is, adding one to an integer value in this range corresponds
to a 20 mV increase in the analog voltage.
This resolution is inadequate for some purposes, including the GLOBE/GIFTS water vapor
instrument. The panel meter on the GLOBE/GIFTS water vapor instrument displays voltages to the
nearest millivolt and a change of just a few millivolts is significant. The next common resolution
level is 12 bits. This divides a 5.0 V signal into 4096 possible values, from 0 through 4095. This
gives a voltage resolution of 5/4095=0.00122 V, or about 1.2 mV. This resolution is adequate, if
just barely, for the GLOBE/GIFTS water vapor instrument. A/D converters with higher resolution are
available, but they are much more expensive than 12-bit converters.
7. What Is a Geostationary (or Geosynchronous) Orbit?
(back to the Table of Contents)
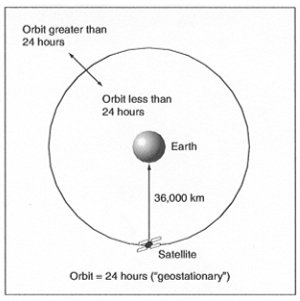 |
| Figure 14. Geosynchronous/geostationary Earth orbits. |
The spacecraft on which GIFTS will fly will be in a geosynchronous orbit. What does this mean?
When scientists need to make measurements continuously over a particular part of Earth, they
place spacecraft in circular orbits whose rotation rate around Earth - the orbit period - is equal
to exactly one day. These are called geosynchronous or geostationary orbits, shown schematically in
Figure 14.
The planes of geosynchronous orbits can be tilted relative to Earth's equator. So, the point
directly under a spacecraft in a geosynchronous orbit moves north and south of the equator during a
day. Usually, the orbit inclination is small, so instruments in geosynchronous orbits have a continuous
view of nearly the same portion of Earth's surface.
Geostationary orbits are a special case of geosynchronous orbits. They lie in the plane of
Earth's equator so that the inclination (tilt) of their orbit plane relative to Earth's equator
is 0°. Thus, they are always directly above a fixed point on Earth's equator and they can continuously
observe the same portion of Earth's surface.
Some geosynchronous/geostationary spacecraft have onboard propulsion systems that can be
used to move them to different locations over the equator. (A minimum propulsion system is needed
to maintain keep the spacecraft's orbit at a period of exactly 24 hours. Note that satellites in
geosynchronous orbits are critical to modern communications. Their fixed (or nearly fixed) position
above Earth's surface is critical for sending, receiving, and relaying messages and data around the
world.
.
The period of an Earth-orbiting spacecraft T is given by:
where G is Earth's gravitational constant, G = 398601.2 km3/s2, and r is the distance of the
spacecraft from the center of Earth. Usually, the altitude a of a spacecraft is given rather than its
distance from the surface of the earth, so this value must be added to Earth's radius R, which is
about 6378 km at the equator:
Many Earth-observing satellites are in orbits a few hundred kilometers above Earth's surface.
Suppose a = 300 km:
| r = 6378 + 300 = 6678 km | (7.3) |
| T = (2π)(6678)(6678/398601.2)1/2 = 5431 s = 96.5 min | (7.4) |
This orbit period is only about an hour and a half. As shown in equation (7.1), the period
increases as the spacecraft's altitude increases. In order to calculate the altitude needed for
the orbit period to be equal to 24 hours (86,400 seconds), solve for r:
| r = [(T)(G1/2)/( 2π)]2/3 |
(7.5) |
| rgeosynchronous = [(86400)(398601.21/2)/(2π)]2/3 = 42241 km
| (7.6) |
| a = 42241 - 6378 = 35863 km | (7.7) |
So, a geosynchronous orbit is at an altitude nearly six Earth radii from Earth's surface.
This altitude imposes some restrictions on the minimum size of features that space-based instruments
can distinguish on Earth, but in return for reduced resolution, instruments have continuous coverage
of large portions of Earth's surface. Note that while an instrument in orbit only a few hundreds of
kilometers from Earth's surface cannot view very much of the Earth/atmosphere system at any time
(because it is relatively close to the surface), instruments in a geosynchronous orbit can see almost
an entire hemisphere. This kind of coverage is very important for understanding the "big picture" of
what is happening in the Earth/atmosphere system.
8. What Is the Greenhouse
Effect? (A "Thought Experiment" for Older Students)(back to the Table of Contents)
The phrases "greenhouse gas" and "greenhouse effect" are now closely associated with the idea
of global climate change. The phrase "greenhouse effect" comes from the analogy with a glass-enclosed
greenhouse. When sun shines on a greenhouse, the inside of the greenhouse rapidly warms to a
temperature much higher than that of the outside air. This is because the greenhouse glass allows
most solar radiation to enter the greenhouse. This radiation warms the interior of the greenhouse.
But, the thermal radiation that is then emitted by objects in the greenhouse (including the air in
the greenhouse) is blocked by the glass.
On Earth, it is easy to show that, in a similar fashion, the atmosphere traps radiation from
the sun so that the surface of Earth is warmer than it would be without an atmosphere. This is due
to greenhouse gases in the atmosphere, of which water vapor is the most important. How does this
phenomenon work?
The basic physical principle is the requirement that all objects, including the
Earth/atmosphere system, must be in "radiative balance" with their surrounding environment.
This means that the Earth/atmosphere system must radiate into space exactly the same amount of
energy that it receives from the sun. An object that is in radiative balance has a constant average
temperature.
The Sun emits a lot of energy - a total of about 3.9x1026 W! Earth is about 150,000,000
km away from the Sun, so only a very little of this energy reaches our planet. The amount of
solar energy falling on a surface at the average earth-sun distance, S, is about 1370 W/m2. This
value is often called the solar constant even though it varies a little due to fluctuations in
the sun's energy output. The solar constant also varies during the course of a year, as Earth
is in a slightly elliptical orbit, but we can ignore that effect in this discussion. Earth
intercepts an amount of energy equal to S times its cross-sectional area, πr2, where r is
Earth's radius. So,
| incoming energy at Earth = πr2S |
(8.1) |
However, the Earth/atmosphere system doesn't absorb all the solar energy. The absorption is
controlled by the system's reflectivity, or albedo A, a dimensionless value that can range from
0 to 1. If Earth and its atmosphere were black, its albedo would be equal to 0 and it would absorb
all the energy. If it were white, its albedo would be 1 and it would reflect all the energy.
(Although the terms "black" and "white" imply "colors" in the visible sense, the concept of albedo
is the same for the solar spectrum, which extends far beyond the visible part of the spectrum.) The
average albedo of the Earth/atmosphere atmosphere system as viewed from space is about 0.30. The
amount of energy absorbed by the Earth/atmosphere system is
| energy absorbed by Earth = πr2S(1 - A) | (8.2)
|
All objects radiate energy based on their temperature. The amount of this outgoing energy is
described by the well known Stefan-Boltzmann Law, which states that the amount of energy radiated by
a perfect radiator (a "blackbody" radiator) is proportional to the fourth power of the temperature T
of the radiator, σT4, where T is in Kelvins and σ is the proportionality constant. If T is the
average temperature of the Earth/atmosphere system, then the radiation (the thermal emission) from
Earth's entire surface is:
| outgoing energy at earth = 4πr2σT4 |
(8.3) |
where σ, the Stefan-Boltzmann constant, is 5.67x10⁻⁸ W/(m2K4). Although Earth's
albedo prevents it from absorbing all the incoming solar energy, it nonetheless acts almost like a perfect blackbody
radiator when it emits thermal energy.
So, in order for the Earth/atmosphere system to be in radiative balance,
(Note that the πr2 terms cancel.) From this equation, we can calculate T:
| T = [S(1 - A)/(4σ)](1/4) = [1370·(1-0.3)/(4·5.67x10-8)]
(1/4) = 255K | (8.5) |
Converting from Kelvins to degrees Celsius (centigrade), 273K = 0ºC. (That is, absolute zero is
about -273ºC.) From this we can see that the temperature of the Earth/atmosphere system as viewed
from space is -18ºC. However, the actual average temperature of Earth's surface is about 16ºC (289K),
about 34ºC warmer than the Earth/atmosphere system as viewed from space.
This is a big difference and, if our planet had evolved at a temperature of -18ºC, it would be
a much different place! The difference between the temperature calculated in equation (8.5) and the
actual average temperature at Earth's surface is explained by the greenhouse effect. The details of
the greenhouse effect are complicated and somewhat uncertain, but their average effect can be
incorporated into our model in a conceptually simple way.
In the previous model, we considered the temperature at the top of the atmosphere, as Earth
is viewed from space. Now imagine a thin layer of the atmosphere close to Earth's surface, so the
temperature of the layer is the same as that of the surface. The incoming solar energy is still
πr2S(1 - A), but this layer also absorbs a fraction x of the energy that is being emitted by Earth
at temperature T. (We'll call x the single-layer atmosphere absorption coefficient.) To maintain
radiative balance, this energy is re-emitted by the layer in all directions. Half this energy is
directed toward Earth's surface, and the other half is directed back out toward space. For simplicity,
assume that Earth's surface completely absorbs all this re-radiated energy. This assumption isn't
too bad because the relatively high albedo of the Earth/atmosphere system as viewed from space
(the value of 0.3 used above) is due mainly to clouds. Almost all of Earth's surface
(especially oceans) has a much lower albedo than this.
Now, equations (8.2) and (8.3) can be rewritten as:
| incoming energy at Earth's surface = πr2[S(1 - A) + 4(x/2)σT4] |
(8.6) |
| outgoing energy from Earth's surface = πr24(1 - x/2)σT4
| (8.7) |
This equation can also be solved for T if a value is assumed for x:
| T4 = S(1 - A)/[4σ(1 - x)] | (8.8) |
Note that (8.8) is nearly identical to (5), differing only by the (1 - x) term in the denominator
that accounts for energy absorbed by the atmosphere. The value of x is controlled by the concentration
of greenhouse gases, including water vapor, in the atmosphere. If x is zero, that is, if there is no
greenhouse effect, then (8.8) is identical to (8.5).
Note that the T in (8.8) is now assumed to be Earth's surface temperature, not the
top-of-the-atmosphere temperature - the temperature of the Earth/atmosphere system as seen from
outer space. Some of the radiation from this imaginary layer of atmosphere is re-radiated to
other, higher, layers, which also absorb and re-radiate energy. These layers get colder, in
general, at higher altitudes. At the highest layer - the top of the atmosphere - there is no
absorption and T is once again equal to the value obtained from (8.5).
Figure 15 shows T as a function of x for equation (8.8). The radiative behavior of the atmosphere
is extremely complex, so it is important not to attribute too much importance to the numerical values
in Figure 15. However, the figure does illustrate the concept of the greenhouse effect.
Note that (8.8) is undefined when x equals 1. As x approaches 1, the surface temperature increases
dramatically, producing a "runaway greenhouse effect" such as appears to exist on Venus.
 |
| Figure 15. Earth's surface temperature as a function of single-layer atmospheric absorption coefficient x.
(x = 0.394 corresponds to the current average surface temperature of 16°C.) |
9. A Brief Introduction
to the Theory of the GLOBE/GIFTS Water Vapor Instrument(back to the Table of Contents)
The GLOBE/GIFTS water vapor instrument contains detectors that respond to sunlight at two small
wavelength ranges in the near-IR part of the solar spectrum. The basic equation describing the
transmission of sunlight through a medium such as the atmosphere (or, to put it another way, the
extinction of sunlight through processes of scattering and absorption by molecules and particles in
the atmosphere) is the Beer-Lambert-Bouguer Law:
where Io,λ is the intensity of a narrow beam of sunlight at a particular wavelength as it
reaches the Earth/atmosphere system, Iλ is the intensity of the sunlight as it reaches an observer
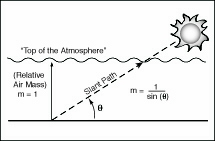
at Earth's surface, m is the relative air mass above the observer (as described in Section 2.6) and α
is the atmospheric optical thickness. Optical thickness is a measure of how the atmosphere reduces the
amount of sunlight reaching Earth's surface. If α=0, then Iλ=Io,λ.
There are two important features of this equation:
1. The equation applies, in principle, to a single wavelength. In practice, sun photometers
detect sunlight over a small range of wavelengths.
2. The equation applies only to direct sunlight. Sunlight reaching Earth's surface is a
combination of radiation coming directly from the sun and radiation scattered toward the surface
by the atmosphere. For the Beer-Lambert-Bouguer equation to apply, scattered sunlight must not reach
the detectors. To comply with this requirement, a sun photometer restricts the "field of view" of its
sensor(s) to a narrow cone of sunlight. This is why the GLOBE/GIFTS instrument has only a small hole
through which sunlight enters the instrument.
Conceptually, it may be easier to replace the somewhat abstract term "optical thickness" in
equation (1) with "percent transmission." This is the percent of sunlight that reaches Earth's
surface at a particular wavelength. The relationship between optical thickness and percent
transmission is
| % transmission = 100 ·e-α | (9.2) |
For small values of optical depth (much less than 1), percent transmission is approximately
equal to 1 - α.
For a near-IR detector whose response lies outside a water vapor absorption band, the
optical thickness is determined by aerosols and molecular scattering (Rayleigh scattering):
| Iλ,1 = Io,λ,1 exp[(-αa,1 - αR,1)
m] | (9.3) |
For a detector inside a water vapor absorption band, there is an additional contribution from water
vapor absorption:
| Iλ,2 = Io,λ,1 exp[αa,2
- αR,2 - αwv)m] | (9.4) |
The difference between αR,2 and αR,1 can be calculated. The difference between
αa,2 and αa,1 must be estimated or measured independently; typically the difference is small.
Once this is done, then the measured ratio Iλ,2 / Iλ,1 can be used to calculate PW.
Calibration of this kind of water vapor instrument involves determining specifically how the
intensity ratio varies with water vapor. In principle, this relationship can be determined
theoretically, based on an accurate knowledge of the transmission properties of the atmosphere
and the spectral response characteristics of the detectors. As a practical matter, it is a better
idea to try to calibrate this kind of instrument by comparing its results to other measurements of
atmospheric water vapor. In any case, calibration of water vapor instruments is difficult because
there is no direct measurement that can serve as a reference standard.
10. Alignment with Science Education Standards
(back to the Table of Contents)
The correlation of material in this document with science education standards is based upon the
essential elements of inquiry learning described in both National Science Education Standards and the
AAAS Benchmarks. Using these documents as a foundation, the Council of State Science Supervisors
(CSSS) through the CS3/NASA NLIST Initiative has operationally defined Science as Inquiry as
consisting of:
(1) CONCEPTUAL CONTEXT FOR SCIENCE CONTENT
Learning set in a broad context (concepts) can enable deeper understanding and enhance the
transfer of knowledge to new and different situations.
(2) RELEVANT AND IMPORTANT SCIENCE CONTENT
Content provides building blocks for constructing and comprehending important concepts.
(3) INFORMATION PROCESSING SKILLS
Skill development becomes the means for continuing the generation of new knowledge.
(4) SCIENTIFIC HABITS OF MIND (APPROACHES)
Habits of mind employed by experts and nurtured in learners can insure the integrity of the
discipline and provide a valid world-view from the perspective of science.
When these essential elements are brought together in school learning environments, science becomes
both relevant for and applicable to all learners.
The correlations in some cases identify specific sections of this report that are directly
relevant to a particular conceptual context or content standard. Concepts or content standards to
which the topic of this report does not apply are not included. A matrix provides the user with a
generalized look across the material as it relates to the essential elements of Science as Inquiry
identified from both NSES Standards and AAAS Benchmarks.
(1) CONCEPTUAL CONTEXT FOR LEARNING CONTENT
NSES
Unifying Concepts and Processes
STANDARD: As a result of activities in grades K-12, all students should develop understanding
and abilities aligned with the following concepts and processes:
Systems, order, and organization
Evidence, models, and explanation
Constancy, change, and measurement
Evolution and equilibrium
Form and function
The unifying concepts and processes in this standard are a subset of the many unifying
ideas in science and technology. Some of the criteria used in the selection and organization of
this standard are:
The concepts and processes provide connections between and among traditional scientific
disciplines.
Earth science ties together traditional science disciplines such as physics, chemistry, and
biology. The hydrologic cycle is a major component of Earth science, and the water vapor measurement
aids in the understanding of the hydrologic cycle.
The concepts and processes are fundamental and comprehensive.
The water vapor measurement, conducted in conjunction with other atmospheric observations,
provide a comprehensive view of Earth's atmosphere.
The concepts and processes are understandable and usable by people who will implement science
programs.
The report includes material that will help educators understand the water vapor
measurement and its relationship to Earth science.
The concepts and processes can be expressed and experienced in a developmentally appropriate
manner during K-12 science education
Gathering, reporting, and analyzing data gives students a wide range of appropriate
activities.
These four concepts are addressed specifically in:
Section 2.6. Water Vapor Protocol Introduction,
Section 2.10. Questions and Answers for the Water Vapor Protocol
Section 2.11. Looking at the Data
Related activities are presented in:
Section 5. Learning Activity: Measuring Dewpoint Temperature
Section 8. What Is the Greenhouse Effect?
BENCHMARKS
By the end of the 8th grade, students should know that
Because the earth turns daily on an axis that is tilted relative to the plane of the earth's
yearly orbit around the sun, sunlight falls more intensely on different parts of the earth during
the year. The difference in heating of the earth's surface produces the planet's seasons and weather
patterns.
Water vapor has a seasonal component that is especially evident in temperate climates.
The cycling of water in and out of the atmosphere plays an important role in determining
climatic patterns. Water evaporates from the surface of the earth, rises and cools, condenses
into rain or snow, and falls again to the surface. The water falling on land collects in rivers
and lakes, soil, and porous layers of rock, and much of it flows back into the ocean.
Understanding the distribution of water vapor helps to understand the hydrologic cycle.
Heat energy carried by ocean currents has a strong influence on climate around the world.
Global satellite images of water vapor help to understand ocean currents.
By the end of the 12th grade, students should know that
Life is adapted to conditions on the earth, including the force of gravity that enables the
planet to retain an adequate atmosphere, and an intensity of radiation from the sun that allows
water to cycle between liquid and vapor.
Measurements of water vapor and associated observations help to understand the hydrologic cycle
and its relationship to the atmosphere and meteorology. Section 8. What Is the Greenhouse Effect?
deals specifically with the concepts of radiative equilibrium and its role in maintaining an
appropriate environment for life on Earth.
Weather (in the short run) and climate (in the long run) involve the transfer of energy
in and out of the atmosphere. Solar radiation heats the land masses, oceans, and air. Transfer
of heat energy at the boundaries between the atmosphere, the land masses, and the oceans results
in layers of different temperatures and densities in both the ocean and atmosphere. The action of
gravitational force on regions of different densities causes them to rise or fall-and such circulation,
influenced by the rotation of the earth, produces winds and ocean currents.
Variations in water vapor are associated with weather patterns and ocean currents.
By the end of the 8th grade, students should know that
A system can include processes as well as things.
The hydrologic cycle is a process.
Thinking about things as systems means looking for how every part relates to others.
The output from one part of a system (which can include material, energy, or information)
can become the input to other parts. Such feedback can serve to control what goes on in the
system as a whole.
The hydrologic cycle is one part of Earth's weather/climate system.
Any system is usually connected to other systems, both internally and externally. Thus a
system may be thought of as containing subsystems and as being a subsystem of a larger system.
Relating water vapor to other observable features of weather and the atmosphere helps to understand
interrelated systems. "Getting Ready to Take Measurements" in Section 2.9 helps students to relate
various parts of a system to each other.
Physical and biological systems tend to change until they become stable and then
remain that way unless their surroundings change.
Section 8. What Is the Greenhouse Effect? addresses this question.
A system may stay the same because nothing is happening or because things are happening
but exactly counterbalance one another.
Section 8. What Is the Greenhouse Effect? addresses this question.
Many systems contain feedback mechanisms that serve to keep changes within specified limits.
The hydrologic cycle is an excellent example of a feedback mechanism. Section 8. What Is the
Greenhouse Effect? also addresses this question.
Symbolic equations can be used to summarize how the quantity of something changes
over time or in response to other changes.
Section 4. Calculating Dewpoint Temperature and Section 8. What is the Greenhouse
Effect? contain these kinds of equations, but not in a mathematical language that is suitable for
8th graders.
Cycles, such as the seasons or body temperature, can be described by their cycle length
or frequency, what their highest and lowest values are, and when these values occur. Different
cycles range from many thousands of years down to less than a billionth of a second.
Section 2.11. Looking at the Data suggests looking at seasonal cycles in water vapor.
Section 2.4. Science Concepts and 2.6. Water Vapor Protocol Introduction suggest looking at
diurnal cycles, as well.
As the complexity of any system increases, gaining an understanding of it depends
increasingly on summaries, such as averages and ranges, and on descriptions of typical
examples of that system.
Section 2.11. Looking at the Data suggests ways to analyze and interpret water vapor
data.
By the end of the 12th grade, students should know that
A system usually has some properties that are different from those of its parts, but
appear because of the interaction of those parts.
The difference between weather and climate helps to explain this concept. For example, the
relatively stable global temperature system is maintained by the interaction of weather systems,
which produce temperature extremes on regional and temporal scales.
Understanding how things work and designing solutions to problems of almost any kind can
be facilitated by systems analysis. In defining a system, it is important to specify its boundaries
and subsystems, indicate its relation to other systems, and identify what its input and its output
are expected to be.
The successful operation of a designed system usually involves feedback. The feedback of
output from some parts of a system to input of other parts can be used to encourage what is going
on in a system, discourage it, or reduce its discrepancy from some desired value. The stability of a
system can be greater when it includes appropriate feedback mechanisms.
Even in some very simple systems, it may not always be possible to predict accurately the
result of changing some part or connection.
A study of weather patterns, water vapor, and the hydrologic cycle provides insight to these
three concepts.
By the end of the 12th grade, students should know that
A system in equilibrium may return to the same state of equilibrium if the disturbances it
experiences are small. But large disturbances may cause it to escape that equilibrium and eventually
settle into some other state of equilibrium.
The "runaway greenhouse effect" mentioned in Section 8. What is the Greenhouse Effect?
is an example of possible effects of large disturbances.
Graphs and equations are useful (and often equivalent) ways for depicting and analyzing patterns
of change.
Sections 2.10. Questions and Answers for the Water Vapor Protocol and 2.11. Looking at
the Data suggest ways to depict and analyze changes in water vapor.
In many physical, biological, and social systems, changes in one direction tend to produce
opposing (but somewhat delayed) influences, leading to repetitive cycles of behavior.
Seasonal cycles in water vapor, and their relationship to the apparent motion of the sun around
Earth suggest one kind of cycle.
By the end of the 12th grade, students should know that
Representing large numbers in terms of powers of ten makes it easier to think about them
and to compare things that are greatly different.
The calculations discussed in Section 8. What is the Greenhouse Effect? illustrate the usefulness
of "powers of ten" (scientific) notation.
As the number of parts of a system increases, the number of possible interactions between
pairs of parts increases much more rapidly.
The discussion of a very simple climate model in Section 8. What is the Greenhouse Effect?
suggests that Earth's climate is extremely complex, with many possible interactions among parts
of the system.
(2) IMPORTANT AND RELEVANT CONTENT
NSES
By the end of the 8th grade, students should know that
Energy cannot be created or destroyed, but only changed from one form into another.
The hydrologic cycle is an example of energy transformation.
Most of what goes on in the universe-from exploding stars and biological growth to the
operation of machines and the motion of people-involves some form of energy being transformed
into another. Energy in the form of heat is almost always one of the products of an energy
transformation.
The hydrologic cycle involves the release of energy in the form of heat.
Heat can be transferred through materials by the collisions of atoms or across space by
radiation. If the material is fluid, currents will be set up in it that aid the transfer of heat.
The hydrologic cycle involves both radiative and convective heat transfer.
Energy appears in different forms. Heat energy is in the disorderly motion of molecules;
chemical energy is in the arrangement of atoms; mechanical energy is in moving bodies or in
elastically distorted shapes; gravitational energy is in the separation of mutually attracting
masses.
The hydrologic cycle is an example of energy transformation.
CONTENT STANDARD D:
As a result of their activities in grades 5-8, all students should develop an understanding of
Water, which covers the majority of the earth's surface, circulates through the crust, oceans,
and atmosphere in what is known as the [hydrologic or] "water cycle." Water evaporates from the
earth's surface, rises and cools as it moves to higher elevations, condenses as rain or snow, and
falls to the surface where it collects in lakes, oceans, soil, and in rocks underground.
Measuring water vapor helps to understand the hydrologic cycle.
The atmosphere is a mixture of nitrogen, oxygen, and trace gases that include water vapor. The
atmosphere has different properties at different elevations.
"Investigating Water Vapor" in Section 2.6. Water Vapor Protocol Introduction indicates that
the measurement is an attempt to determine water vapor in the entire column of atmosphere above
an observer. Section 2.10. Questions and Answers for the Water Vapor Protocol includes a
discussion of the fact that a relationship between surface conditions and total atmospheric
water vapor can be only approximate (because the amount of water vapor varies with altitude).
Clouds, formed by the condensation of water vapor, affect weather and climate.
Global satellite images of water vapor show their association with weather systems.
Global patterns of atmospheric movement influence local weather. Oceans have a major effect on
climate, because water in the oceans holds a large amount of heat.
Global satellite images of water vapor show their association with weather systems. Section
2.11. Looking at the Data discusses the seasonal cycle in water vapor.
EARTH IN THE SOLAR SYSTEM
The sun is the major source of energy for phenomena on the earth's surface, such as growth
of plants, winds, ocean currents, and the water cycle. Seasons result from variations in the
amount of the sun's energy hitting the surface, due to the tilt of the earth's rotation on its
axis and the length of the day.
Water vapor cycles are discussed in Section 2.11. Looking at the Data.
By the end of the 12th grade, students should know that
Whenever the amount of energy in one place or form diminishes, the amount in
other places or forms increases by the same amount.
The concept of radiative equilibrium, as discussed in Section 8. What Is the Greenhouse
Effect?, as well as the concepts of global weather patterns as shown in global satellite
images of water vapor and clouds, help to illustrate this concept.
Transformations of energy usually produce some energy in the form of heat, which spreads
around by radiation or conduction into cooler places. Although just as much total energy remains,
its being spread out more evenly means less can be done with it.
Evaporation, condensation, and transpiration are processes involving the exchange of
heat energy by radiation or conduction.
Different energy levels are associated with different configurations of atoms and molecules.
Some changes of configuration require an input of energy whereas others release energy.
Evaporation, condensation, and transpiration in the hydrologic cycle illustrate how water molecules
can exist in different configurations.
BENCHMARKS
By the end of the 8th grade, students should know that
The earth is mostly rock. Three-fourths of its surface is covered by a relatively thin layer
of water (some of it frozen), and the entire planet is surrounded by a relatively thin blanket of
air. It is the only body in the solar system that appears able to support life. The other planets
have compositions and conditions very different from the earth's.
Everything on or anywhere near the earth is pulled toward the earth's center by gravitational
force.
Because the earth turns daily on an axis that is tilted relative to the plane of the earth's
yearly orbit around the sun, sunlight falls more intensely on different parts of the earth during
the year. The difference in heating of the earth's surface produces the planet's seasons and weather
patterns.
Climates have sometimes changed abruptly in the past as a result of changes in the earth's crust,
such as volcanic eruptions or impacts of huge rocks from space. Even relatively small changes in
atmospheric or ocean content can have widespread effects on climate if the change lasts long enough.
The cycling of water in and out of the atmosphere plays an important role in determining
climatic patterns. Water evaporates from the surface of the earth, rises and cools, condenses
into rain or snow, and falls again to the surface. The water falling on land collects in rivers
and lakes, soil, and porous layers of rock, and much of it flows back into the ocean. The seasons
are a subtle combination of global and orbital geometry and of the effects of radiation at different
angles.
These five content statements, describing Earth as a dynamic and interconnected system, can be
addressed with water vapor measurements in conjunction with other experiment protocols supported
by the GLOBE Program.
Heat energy carried by ocean currents has a strong influence on climate around the world.
Global satellite images of water vapor show the influence of ocean currents.
By the end of the 8th grade, students should know that
Light from the sun is made up of a mixture of many different colors of light, even though
to the eye the light looks almost white. Other things that give off or reflect light have a
different mix of colors.
Something can be "seen" when light waves emitted or reflected by it enter the eye-just as
something can be "heard"when sound waves from it enter the ear.
Human eyes respond to only a narrow range of wavelengths of electromagnetic radiation-visible
light. Differences of wavelength within that range are perceived as differences in color.
Because the water vapor instrument uses near-IR detectors, this provides one way to address these
three content statements. Section 2.7 Suggestions for Student and Classroom Preparation contains
some specific suggestions for dealing with the concept of "invisible" light.
(3 & 4) SCIENCE SKILLS AND SCIENTIFIC HABITS OF MIND
NSES
As a result of their activities in grades 5-8, all students should develop an understanding of:
Identify questions that can be answered through scientific investigations
Design and conduct a scientific investigation
Use appropriate tools and techniques to gather, analyze, and interpret data
Develop descriptions, explanations, predictions, and models using evidence
Think critically and logically to make the relationships between evidence and explanations
Recognize and analyze alternative explanations and predictions
Communicate scientific procedures and explanations
Use mathematics in all aspects of scientific inquiry
Different kinds of questions suggest different kinds of scientific investigations
Technology used to gather data enhances accuracy and allows scientists to analyze and quantify
results of investigation
The water vapor protocol, especially in conjunction with other GLOBE-supported protocols, provide
numerous opportunities to develop these skills. See the more detailed references for grades 9-12,
below.
As a result of their activities in grades 9-12, all students should develop an understanding of:
Identify questions and concepts that guide scientific investigations
Section 2.6 Water Vapor Protocol Introduction helps students identify appropriate
questions and concepts.
Design and conduct scientific investigations
This report provides a detailed guide to designing and conducting a scientific
investigation into the distribution of water vapor.
Use technology and mathematics to improve investigations and communications
As described in Sections 2.9 Classroom Guide to Field Work and Section 3. Guide to Data Logger
Hardware and Software, and Section 6. How Do Analog-To-Digital Converters Work?, computer technology
allows scientists to capture data directly in computers.
Formulate and revise scientific explanations and models using logic and evidence
Recognize and analyze alternative explanations and models
Communicate and defend a scientific argument
Especially when undertaken as part of a broader investigation of the atmosphere, the water vapor
measurement will help students develop these skills.
Scientists rely on technology to enhance the gathering and manipulation of data
Section 2.6 Water Vapor Protocol Introduction and Section 2.10 Questions and Answers
for the Water Vapor Protocol discuss how inexpensive light detector technology has been applied
to this measurement.
Mathematics is essential in scientific inquiry
The equations in Section 2.10 Questions and Answers for the Water Vapor Protocol and
Section 8. What is the Greenhouse Effect? show how mathematics are used in this inquiry.
Scientific explanations must adhere to criteria such as: a proposed explanation must be
logically consistent; it must abide by the rules of evidence; it must be open to questions on
possible modification; and, it must be based on historical and current scientific knowledge
By designing and conducting their own experiments, students will better understand the nature
of scientific explanation.
BENCHMARKS
By the end of the 8th grade, students should
Be skeptical of arguments based on very small samples of data, biased samples, or samples
for which there was no control sample.
Be aware that there may be more than one good way to interpret a given set of findings.
Looking for and analyzing water vapor trends will help to develop these skills.
By the end of the 12th grade, students should
Check graphs to see that they do not misrepresent results by using inappropriate scales or
by failing to specify the axes clearly.
Wonder how likely it is that some event of interest might have occurred just by chance.
Insist that the critical assumptions behind any line of reasoning be made explicit so that
the validity of the position being taken-whether one's own or that of others-can be judged.
Be aware, when considering claims, that when people try to prove a point, they may select
only the data that support it and ignore any that would contradict it.
Looking for and analyzing water vapor trends will help to develop these skills. The
relationship between dewpoint temperature and water vapor discussed in Section 2.10 Questions
and Answers for the Water Vapor Protocol could be used as an example of how temperature and
humidity data provide an incomplete picture of the factors influencing atmospheric water vapor.
By the end of the 8th grade, students should be able to
Use calculators to compare amounts proportionally.
Use computers to store and retrieve information in topical, alphabetical, numerical,
and key-word files, and create simple files of their own devising.
Read analog and digital meters on instruments used to make direct measurements of length,
volume, weight, elapsed time, rates, and temperature, and choose appropriate units for reporting
various magnitudes.
Use cameras and tape recorders for capturing information.
Inspect, disassemble, and reassemble simple mechanical devices and describe what the various
parts are for; estimate what the effect that making a change in one part of a system is likely to
have on the system as a whole.
All of these skills can be developed as a result of collecting and analyzing water vapor data,
especially in conjunction with measurements of other atmospheric properties.
Table 4. Document correlations with broad areas of standards and benchmarks
| Section Number | Conceptual Theme | Content ES/PS | Skills IN/NIS | Habits of Mind | Mathematics | Technology
|
|---|
| 2.1 | | | | | |
|
| 2.2 | | | | | |
|
| 2.3 | | | | | |
|
| 2.4 | | | | | |
|
| 2.5 | | | | | |
|
| 2.6 | X | X | X | | X | X
|
| 2.7 | | X | | | |
|
| 2.8 | | X | X | | X | X
|
| 2.9 | X | X | X | X | X | X
|
| 2.10 | X | | X | X | X |
|
| 2.11 | X | X | X | X | X | X
|
| 3 | | | | | |
|
| 4 | | X | | | X |
|
| 5 | | X | X | X | |
|
| 6 | | | | | X | X
|
| 7 | | | | | X |
|
| 8 | X | X | | X | X |
|
| 9 | | | | | X |
|
ES = Earth Science PS= Physical Science IS= Integrated skills NIS= Non-integrated skills
An X in a box for a section number indicates one or more items relating to that particular category
11. Acknowledgements and Disclaimer
(back to the Table of Contents)
The original GLOBE Water Vapor protocol was prepared with the support of the National Science Foundation, through award
0222380. Any opinions, findings, and conclusions or recommendations expressed in this report are those of the authors and
do not necessarily reflect the views of either the GLOBE Program or the National Science Foundation. Some of the material in Section
10 has been prepared by Joseph D. Exline, President Exline Consulting Services, Incorporated. Some figures have been prepared for the
GLOBE Program by Schafer-LaCasse Design. The cover design is by Anne Costa, NASA Langley Research Center.
12. References(back to the Table of Contents)
Brooks, D. R., and F. M. Mims. III, Development of an inexpensive handheld LED-based Sun photometer for the GLOBE program. J.
Geophys. Res. 106(D5), 4733-4740, 2001.
Huschke, R. E., Ed., 1959: Glossary of Meteorology. Amer. Meteor. Soc., 638 pp.
Mims, Forrest M. III, An inexpensive and stable LED Sun photometer for measuring the water vapor column over South Texas
from 1990 to 2001, Geophys. Res. Lett., 29, 13, 20-1 -- 20-4, 2002.
Mims, F. M. III, Sun photometer with light-emitting diodes as spectrally selective detectors,
Applied Optics, 31, 6965-6967, 1992.
Reitan, C. H., Surface Dew Point and Water Vapor Aloft, J. Applied Meteorology 2, 776-779, 1963.
13. Field Guides and Data Sheets for Water Vapor
Data Collection(back to the Table of Contents)
Water Vapor Protocol Field Guide (Manual Data Collection)
Tasks
Manually record a set of maximum voltage readings obtained by pointing your water
vapor instrument at the sun.
Record the precise time of your measurements.
Observe and record meteorological, cloud, and sky conditions.
What You Need
- GLOBE water vapor instrument
- Watch, preferably digital
- Barometer (optional)
- Thermometer (optional)
- Water vapor data sheet
- GLOBE cloud chart
- Hygrometer (optional)
In the Field
1. Turn your instrument on.
2. Hold the instrument in front of you in a position where you can read the digital panel meter and can comfortably keep the sun
spot shining through the front alignment bracket and aligned on the rear alignment dot.
3. Set the rotary switch to T and record the voltage.
4. Set the rotary switch to IR1.
5. Adjust the pointing of your instrument until the spot of sunlight coming through the front alignment bracket so that it is
centered on the colored alignment spot on the rear bracket.
During the next 10-15 seconds, observe the voltage displayed on the panel meter and record the maximum voltage
in the "sunlight voltage" column of your Data Sheet.
6. Record the time at which you made the measurement as accurately and precisely as possible.
7. While still pointing your instrument at the sun, cover the sunlight apertures with your finger to block all light
from entering the case. Record this reading in the "dark voltage" column on the Data Sheet.
8. Select the IR2 channel and repeat steps 5-7.
9. Repeat steps 4-8 two more times.
10. Set the rotary switch to T and record the voltage. Then turn off your water vapor instrument.
11. If you are using actual outdoor measurements for air temperature and relative humidity, make these measurements now.
Water Vapor Protocol Field Guide (Automated Data Collection)
Tasks
Record voltage readings obtained by pointing your water vapor instrument at the sun.
Observe and record meteorological, cloud, and sky conditions.
What You Need
- GLOBE water vapor instrument
- Water vapor data sheet
- Barometer (optional)
- Thermometer (optional)
- Hardware A/D interface, laptop, and software
- GLOBE cloud chart
- Hygrometer (optional)
In the field
1. Hold the instrument in front of you in a position where you can read the digital panel meter and can comfortably keep
the sun spot shining through the front alignment bracket and aligned on the rear alignment dot.
2. Turn on your instrument and activate the data collection software.
3. Cover the sunlight apertures with your finger for a few seconds.
4. Center the sunlight spot coming through the hole in the front bracket on the circular dot on the rear bracket and
remove your finger from the sunlight apertures. Hold your instrument in this position for two minutes.
5. At the end of two minutes, cover the sunlight apertures with your finger and hold this position for a few seconds.
6. Stop the logging software and turn off your water vapor instrument.
7. If you are using actual outdoor measurements for air temperature and relative humidity, make these measurements now.
Here are links to data entry sheets for the Water Vapoor Protocol.
Water Vapor Data Reporting Sheet (Word document)
Water Vapor Data Reporting Sheet (HTML document)