4th Annual GLOBE Conference, Durham, New Hampshire, July 18-23, 1999
One way to address these questions is to develop partnerships beyond GLOBE, in which scientists, teachers, and students can participate as equals. All too often, scientists provide teachers with access to data and teaching materials, but expect nothing in return. No matter how sophisticated, such programs are too one-sided to function as partnerships. In the GLOBE model, true partnerships develop when scientists define their needs and schools provide high-quality data that are otherwise difficult or impossible to obtain. However, this ideal arrangement is rarely realized in practice even within GLOBE. In order to develop indispensable partnerships, we must actively seek ways to use the resources GLOBE has to offer. The purpose of this paper is to describe a project that we believe defines such a partnership.
Integrated pest management (IPM) is an area of agricultural science that is currently very much in vogue in the United States. The goal of IPM is to minimize the use of pesticides and other chemical controls in all areas of agriculture, ranging from huge agribusiness operations to individual homeowners treating their lawns and ornamental plants. IPM is important both in developed and developing countries. In countries such as the United States, the widespread use of chemical pest controls has imposed a heavy burden on the environment and agricultural scientists are seeking ways to reverse the escalating dependence on toxic chemicals. In developing countries, there is pressure to "solve" the problem of feeding rapidly growing populations by increasing the use of chemical fertilizers and pest controls. However, this choice not only degrades the environment, but is expensive and ultimately futile.
The quantitative data required to implement IPM programs include growing degree days (GDDs) -- a cumulative measure of air temperature that starts at the beginning of the local growing season -- and related information about, for example, soil temperature and precipitation. The GDD for one day is the average air temperature minus a base temperature. It is common to define the average simply as the average of the daily maximum and minimum temperature. In northern temperate climates, a typical assumption is that the growing season starts March 1, with a GDD base temperature of 50°F. (The use of Fahrenheit degrees is an accommodation that must be made to serve the needs of the agricultural community in the U.S.) The raw data required to calculate GDDs and related values are already part of GLOBE protocols. Because GDDs are cumulative, a continuous air temperature record is a primary requirement.
This extensive network of agricultural extension agents constitutes a natural audience for GLOBE. They need GLOBE's expertise and infrastructure. In return, extension offices can help schools focus on problems of local interest and can provide the kind of professional interaction that leverages GLOBE's limited human resources.
In early spring of 1999, the lead author of this paper approached entomologist David Suchanic at Penn State's Montgomery County Extension Service, who leads an active IPM research program serving commercial horticultural interests in the predominantly suburban counties around Philadelphia. We then contacted the IPM Coordinator at Pennsylvania's Department of Agriculture and secured summer salary support for a student at Philadelphia's W. B. Saul High School of Agricultural Sciences (Kate Schanbacher) to work with us. Because of Suchanic's interest in updating pest emergence tables for ornamental plants, we planned a project to compare various methods of collecting temperature and calculating GDDs at Saul HS (SHS). This school (a non-reporting GLOBE school) has a large campus on the edge of a municipal park in a part of Philadelphia that is more suburban than urban. There is a working farm with livestock, open pastures, and a variety of ornamental plants around the classroom buildings.
Air temperature sources used for this project include manual measurements made at (but never reported by) SHS, automated collection with temperature sensors and a data logger, values reported from the Philadelphia International Airport, temperature data from SkyBit, Inc. (a commercial provider of agricultural meteorology forecasts), and a biophenometer (an instrument that monitors air temperature and continuously calculates GDD). GDD calculations for predicting pest emergence require reliable local air temperature data. Because the calculation is cumulative, systematic errors in modeling, interpolating, or extrapolating air temperature, in lieu of actual measurements, can result in large errors as the growing season progresses. It is well known that differences in terrain and elevation can produce significant and even dramatic air temperature differences over very short distances. These differences affect the local ecosystems within which agricultural pests develop and, hence, affect how controls should be applied.
The environment surrounding SHS, with its gently sloping terrain, open fields, pastures surrounded by trees, and buildings surrounded by ornamentals, is more typical of a small farm or commercial nursery than of an urban high school. Temperatures there are certainly more representative of conditions in the surrounding suburban counties than temperatures taken 10 km away at Philadelphia International Airport, which consists of acres of paving and buildings in a highly urbanized area. It is important to realize that this project can be replicated in other environments. In fact, although GLOBE emphasizes "natural" settings, the needs of the IPM community encompass any environment where things grow. Although it might be argued that GLOBE air temperature measurements are not essential for routine weather forecasting, the same argument cannot be made for IPM. The network of meteorological weather stations is simply too sparse to meet the highly localized needs of IPM modeling.
 |
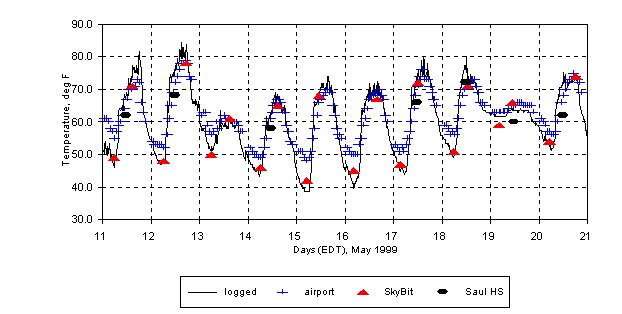
| Figure 1(a). Air temperature data for Saul High School, May 1999. |
 |
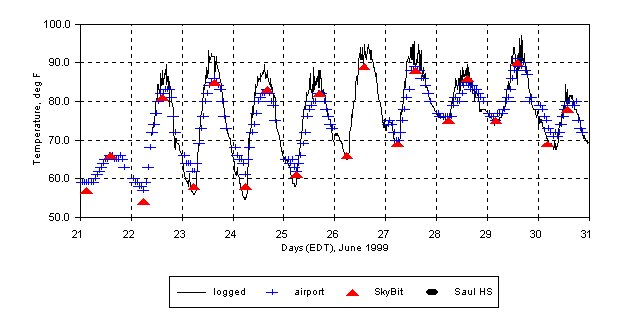
| Figure 1(b). Air temperature data for Saul High School, June 1999. |
An unfortunate gap in logged temperatures from June 10-22, the end of which can be seen in Figure 1(b), demonstrates the importance of maintaining manual measurements along with automated data collection. The SHS temperature collection site is located in a sheep pasture. Despite the consensus among students and teachers that sheep are not very curious animals, it is clear that on several occasions they pulled up the soil temperature sensors and chewed on them. This problem finally was solved by putting a rabbit cage over the area where the sensors were buried. However, when students reconnected the sensor cables, their order was inadvertently reversed and it was learned only later that the air temperature sensor, which previously had been a soil temperature sensor, was no longer functioning. Note that during the 10-day period from June 21 through June 30, at the end of the school year, there were no manual temperature measurements made at SHS.
Sheep attacks aside, there are several features of interest in Figure 1. The PHL temperatures tend often to overestimate the nighttime minimum temperatures and sometimes to underestimate the daytime maximum temperatures at SHS by a few degrees. The systematically lower nighttime temperatures at SHS, relative to PHL, are consistent with an "urban heat island effect" argument. Because PHL is in a heavily urbanized area, it is not surprising that it cools more slowly in the evening than a more suburban environment. PHL is also next to the Delaware River, which may produce a moderating effect on daytime temperatures.
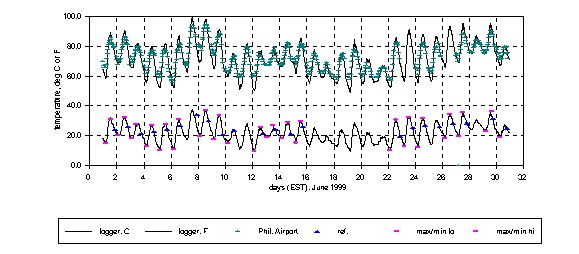 |
| Figure 2. Comparison of suburban and urban (PHL) air temperatures. |
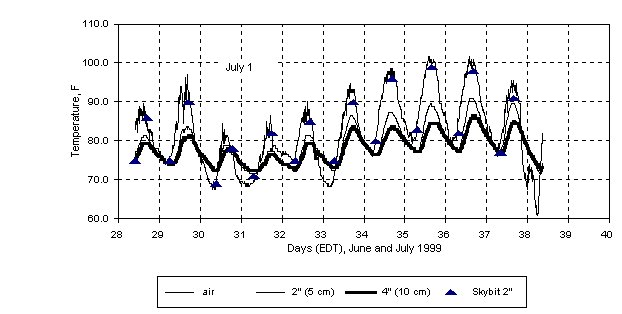 |
| Figure 3. Soil temperatures at Saul High School. |
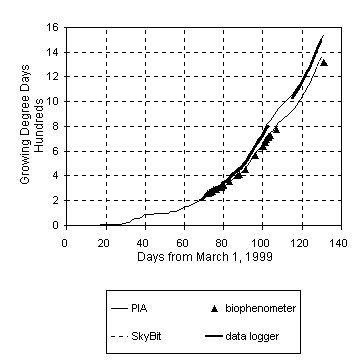 |
| Figure 4. Growing Degree Day calculations. |
| Plant | Location | Pest | Current status |
|---|---|---|---|
| Betula papyrifera(Birch) | in front of gym (full sun) | leaf miner | (larvae and adults)residual damage only |
| Pinus mugho (Mugo pine) | behind fence on Henry Avenue (full sun) | sawfly (larvae) | residual damage only |
| Ilex opaca (American Holly) | in front of building (partial sun) | leaf miner (larvae) | residual damage only |
| Pieres japonica (Andromeda) | in front of building (shady) | lace bug (larvae, nymphs, adults) | heavily infested with extensive damage |
Taken just by themselves, the data we have presented show that even apparently simple quantities such as air and soil temperature are actually very interesting, scientifically valuable, and worthy of more careful attention than they get from the thousands of schools who have provided sporadic and, therefore, essentially useless reports. It is discouraging to note that even though air temperature is the most widely made GLOBE measurement, it is rare to find a temperature record that is suitable for GDD calculations. Soil temperature, which is important for IPM and also for studies of global climate, is rarely reported; a total of a few dozen measurements per week is typical. Considering the fact that soil temperature measurements are easy and inexpensive to make, we believe that they have the highest scientific benefit-to-cost or benefit-to-effort ratio of any neglected GLOBE measurement. Some features of air and soil temperature variation that are of interest to the agricultural community cannot be observed even with a complete manually collected GLOBE data record. Automated data collection can provide a better picture, but there is a significant price to be paid in the extra effort required to maintain and process those data. It is essential to continue an active program of manual data collection both as a backup source of data and to provide younger students with a record that is easier to process and understand.
Finally, we believe some broader lessons can be drawn from this project. In general, GLOBE protocols are only starting points for doing meaningful science. When GLOBE teachers learn protocols and teach them to their students, they are preparing to do real science, but just doing the protocols is not science. We believe it will be helpful for teachers to guide students toward asking appropriate questions so that following GLOBE protocols can be viewed as a necessary part of answering those questions, rather than as an end in itself. Our project suggests several ways that GLOBE protocols can be part of real science investigations; two have been mentioned elsewhere in this paper. To cite just one more example, cold air and soil temperatures are important for many plants and trees in temperate climates. The same kinds of measurements we have been making this summer can be continued through the winter to search for links to bud break and other markers of the beginning of a new growing season.
Finally, when scientists tap into the resources GLOBE has to offer, in search of data for their own research, they must explain their objectives as thoroughly as possible to as large an audience as possible. We have not been successful at engaging a larger community of students and teachers at Saul High School and this is an endeavor that will require more effort as we continue our work there.