Measuring/logging incoming solar radiation
The amount of solar radiation reaching Earth's surface is an important environmental
measurement. It interacts with weather and climate, and has critical
impacts on human health and agriculture. One
measurement is insolation, the total amount of solar radiation
falling on a horizontal plane at Earth's surface, measured in units of watts per square meter
(W/m2).
Solar radiation is measured with instruments called pyranometers. These instruments
respond to a broad range of incoming solar radiation from ultraviolet (wavelengths
below about 400 nm) to infrared (wavelengths above about 800 nm). Laboratory-quality
pyranometers that respond to incoming solar radiation uniformly across a wide range
of wavelengths are very expensive, costing thousands of dollars.
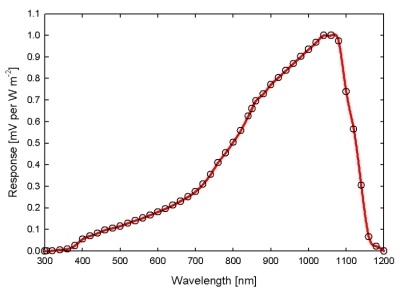
Much less expensive pyranometers use silicon photodiodes. These devices have a
strongly peaked
response to sunlight in the near-IR part of the solar spectrum. Hence, they might
more accurately be described as "surrogate pyranometers." But, because of their
relatively low cost they are widely used for routine solar monitoring in weather
stations and agricultural applications.
For measuring insolation, pyranometers should be mounted
horizontally in a place with an unobstructed view of the horizon in all directions.
Obstructions like buildings and trees will, of course, decrease the received
solar radiation. Measuring solar radiation is especially useful for monitoring
conditions in urban gardens where shadowing from surrounding
structures is important.
It's also common to measure radiation falling on solar photovoltaic
or thermal panels for heating water – these panels are usually mounted at an angle
to the horizontal to maximize their ability to absorb solar radiation.
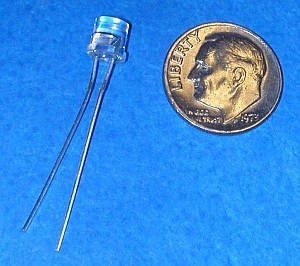
The Institute for Earth Science Research & Education (IESRE) has developed a
low-cost pyranometer using the silicon photodiode shown in the image above. These kinds of
pyranometers (including commercial devices that use the same kinds of
detectors) are passive devices that don't require an external power source.
Insolation under clear summer skies around noon at temperature latitudes is
about 1000 W/m2, which produces an output of about 0.25 V. The
photodetector is mounted in a machined housing and covered with a 3/8" (9.5mm)
diameter Teflon diffuser. The bubble level is for leveling the device when
it's mounted. At the time this document was being written, IESRE pyranometers,
assembled and calibrated, cost $80 including shipping to US addresses. Kits are
available for $30, but once assembled they must be calibrated against a reliable
reference. (See
HERE.)

Can you use Arduinos to record data from these devices? Not with basic
Arduino code for measuring analog inputs. Arduinos process analog voltage inputs
by digitizing them. Arduinos like the widely used UNO operate
on 5 volts, with 10-bit analog-to-digital resolution. This means that
incoming voltages in the range 0–5 V are converted into integers from
0 to 1023. One digital "count" corresponds to 5/1023 V or roughly 5 mV. So,
an input voltage ranging from 0 to 250 mV is represented by a total of only 50
possible values in steps of about 20 W/m2.
This is much too coarse for a representation of incoming solar
radiation!
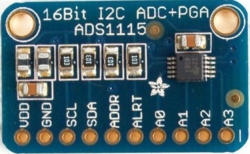
Chapter 17 in David Brooks'
book Monitoring Your Environment with Arduino Microcontrollers, shows how to
solve this problem witih the ADS1115 four-channel, 16-bit programmable gain breakout
board. This is an I2C device that works with almost any microcontroller, including
all Arduinos. (See Chapters 7 and 8 in Brooks' book.) ADS1115 boards are
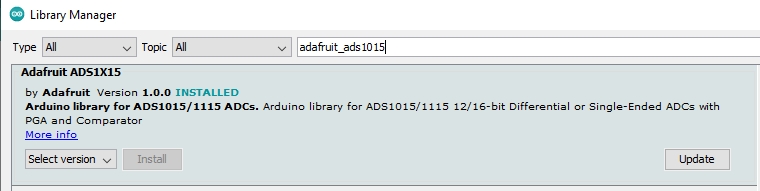
widely available online for less than $10. Several software
libraries for using these boards are also available online. I use the library from
adafruit.com, as shown in the image below. (There are two versions of these boards, 12-bit
(ADS1015) and 16-bit(ADS1115). The 12-bit version is a little cheaper, but the 16-bit
version is the better choice and the library works for either one.)
Here's some code for recording solar data with an Arduino.
/* ADS1115_pyranometer_log, D. Brooks, October 2021
  Shows how to read and log 1 channel from ADS1115 breakout.
*/
#include <Wire.h>
#include <SD.h>
#include <RTClib.h>
RTC_DS1307 rtc;  // for most data logging shields
#include <Adafruit_ADS1015.h> // This library works for both 1015 and 1115
Adafruit_ADS1115 ads(0x48); // default address is 0x48
float V0,DtoA,S;
float V1,V2,V3; // additional channels as needed
int16_t adc0;  // ADC reading produces 16-bit integer
int16_t adc1,adc2,adc3; // additional channels as needed
const long int delayTime=500L;
const int SDpin=10;
File logfile;
char filename[]="LOGSOLAR.CSV";
int year,month,day,hour,minute,second;
void setup(void)
{
  Serial.begin(9600);
  Wire.begin(); ads.begin(); rtc.begin();
  //ads.setGain(GAIN_ONE);       DtoA=0.125/1000;    // 4.096 V
  //ads.setGain(GAIN_TWO);       DtoA=0.0625/1000;   // 2.048 V
  //ads.setGain(GAIN_TWOTHIRDS); DtoA=0.187506/1000; // 6.144 V (default gain)
  //ads.setGain(GAIN_FOUR);      DtoA=0.03125/1000;  // 1.024 V
  ads.setGain(GAIN_EIGHT);     DtoA=0.015625/1000; // 0.512 V
  //ads.setGain(GAIN_SIXTEEN);   DtoA=0.007813/1000; // 0.256 V
  //Comment out rtc.adjust... line after first time this code is uploaded!
  //Don't run program with offline power source with this line active!
  rtc.adjust(DateTime(__DATE__,__TIME__)); // needed only for new RTC not yet set.
  if (!SD.begin(SDpin)) {Serial.println("Card failed.");
    delay(50);exit(0);
  }
  Serial.println("card initialized.");
  logfile = SD.open(filename, FILE_WRITE);
  if (!logfile) {
    Serial.println("Couldn't create file."); delay(50); exit(0);
  }
  Serial.print("Logging to file "); Serial.println(filename);
  // Optionally, write header line here, with logfile.flush
  logfile.println("file header...");
  logfile.flush();

}
void loop(void)
{
  adc0 = ads.readADC_SingleEnded(0);
  //adc1 = ads.readADC_SingleEnded(1);
  //adc2 = ads.readADC_SingleEnded(2);
  //adc3 = ads.readADC_SingleEnded(3);
  V0 = adc0 * DtoA;
  //V1 = adc1 * DtoA;
  //V2 = adc2 * DtoA;
  //V3 = adc3 * DtoA;
  S=V0;
  // Get date and time.
  DateTime now=rtc.now();
  year=now.year(); month=now.month(); day=now.day();
  hour=now.hour(); minute=now.minute(); second=now.second();
  logfile.print(year); logfile.print('/'); logfile.print(month); logfile.print('/');
  logfile.print(day); logfile.print(','); logfile.print(hour); logfile.print(':');
  logfile.print(minute); logfile.print(':'); logfile.print(second);logfile.print(',');
  // Write day expressed as decimal fraction.
  logfile.print(day+hour/24.+minute/1440.+second/86400.,6);
  logfile.print(','); logfile.println(S); logfile.flush();
  Serial.print("Insolation, W/m^2: ");
  Serial.println(S,1);
  delay(delayTime);
}
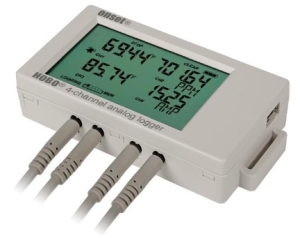
A commercial alternative for recording solar data
For very reliable long-term recording of solar data, it may be worth considering
a commercial data logger instead of an Arduino system.
For many years I have used loggers from Onset
Computer Corporation and I believe that the
UX120-006M four-channel,
16-bit, 0–2.5 VDC logger is
the best device for this purpose. It is considerably more expensive than an Arduino
system; the price at the time this document was written was $145 (plus, perhaps, an additional
cable as noted below).
You will need a 2.5mm stereo cable to connect a pyranometer to this logger. In principle, you can buy
2.5mm plugs and wire them yourself, but they are small and difficult to work with! From
Onset Computer you can get
CABLE-2.5 STEREO for $11. Stereo cables are required for
these loggers, but you need only the ground and tip; the "center" wire isn't
used. Some soldering is still required, but only to connect two wires to your
pyranometer outputs. (You could also use crimp connectors instead.)
If you use an IESRE pyranometer, as cited above, they are
available at the same price with a 2.5mm cable instead of a "bare wire" cable as
would be used with an Arduino-based system.
These loggers are very reliable and will run 24/7 for months on
two AAA batteries.
Software is required to use these loggers, but
HOBOware is a free download
for Windows or Max computers – the "Pro" upgrade isn't needed, as it is
easy to download data as a .CSV file and
process/graph them in a spreadsheet.
For more information about logging solar data, contact
brooksdr@instesre.org.