Figures from Exploring Your Environment with Arduino Microcontrollers
Chapter 2: What You Need to Use This Book
Chapter 4: Blinking Your Own LEDs
 |  |
| Figure 4.1 | Figure 4.2 |
 |  |
| Figure 4.4 | Figure 4.5 |
Chapter 5: Measuring and Displaying Air Temperature
 |  |
| Figure 5.2 | Figure 5.3 |
 | |
| Figure 5.7 | |
Chapter 6: Measuring and Displayiing Light Levels
 |  |
| Figure 6.1 | Figure 6.2 |
 | |
| Figure 6.4 | |
Chapter 7: UIsing Sensor Data to Make Choices
 |
| Figure 7.1 |
Chapter 8: Introductdion to I2C Devices: Sending Output to an LCD
 |  |
| Figure 8.1 | Figure 8.3 |
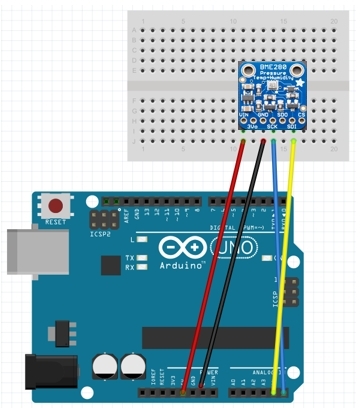
Chapter 9: An I2C Temperature, Humidity, and Pressure Sensor
 |
| Figure 9.1 |
Chapter 10: Logging Sensor Data
 |  |
| Figure 10.1 | Figure 10.6 |
Chapter 11: A "One Wire" Temperature and Humidity Sensor
 |
| Figure 11.2 |
Chapter 12: Using an RGB LED to Respond to Sensor Output Values
 |
| Figure 12.2 |
Chapter 13: Monitoring Soil Moisture
 |  |
| Figure 13.1 | Figure 13.3 |
Chapter 14: Using Solid State Relays to Control External Devices
 |  |
| Figure 14.1 | Figure 14.2 |
 |  |
| Figure 14.3 | Figure14.4 |
 | |
| Figure 14.5 | |
Chapter 15: Measuring Airborne Particulates
 |  |
| Figure 15.1a | Figure 15.1b |
 |  |
| Figure 15.2 | Figure 15.4a |
 |  | |
| Figure 15.5 | Figure 15.6 |
Chapter 16: Measuring Surface Temperatures
 |
| Figure 16.3 |
Chapter 17: Collecting Data from Low-Voltage Output Sensors
 |  |
| Figure 17.1 | Figure 17.3 |
 | |
| Figure 17.4 | |
Chapter 18: More about Relative Humidity Measurements
 |  |
| Figure 18.1(c) | Figure 18.2 |
 | < |
| Figure 18.4 | Figure 18.5 |
Chapter 19: Measuring Light, Revisited
 |
| Figure 19.1 |
Chapter 20: Measuring UV Radiation
Chapter 21: A Packet Radio Weather Station
 |  |
| Figure 21.1 | Figure 21.2 |
 |  |
| Figure 21.3 | Figure 21.4 |
 | |
 |  |
Chapter 22: Some Alternatives to the Arduino UNO and its Compatibles
 |  |
| Figure 22.1 | Figure 22.2 |
Appendix 2: Using Breadboards with Arduinos
 |  |
| Figure A2.1 | Figure A2.2 |
Appendix 3: Electricity Fundamentals for Arduinos
 |
| Figure A3.1 |


