Norfork, Arkansas, USA, make simultaneous
measurements with two GLOBE sun photometers.
Current Scientist/Teacher/Student Collaborations in Atmospheric
Science
Ninth Annual GLOBE Conference
31 July 05 August 2005
Prague, Czech Republic
David R. Brooks, Research Professor
Department of Mechanical Engineering and Mechanics
Drexel University, Philadelphia, Pennsylvania, USA
brooksdr@drexel.edu
Alan Czarnetzki, Professor of Meteorology
University of Northern Iowa, Cedar Falls, Iowa, USA
alan.czarnetzki@uni.edu
Wade Geery, Norfork Elementary School, Norfork, Arkansas, USA
wade@geery.com
Kelen Panec, Waterloo Central Middle School, Waterloo, Iowa, USA
paneck@waterloo.k12.ia.us
Richard Roettger, Ramey School, Aguadilla, Puerto Rico, USA
Richard.Roettger@am.dodea.edu
|
|
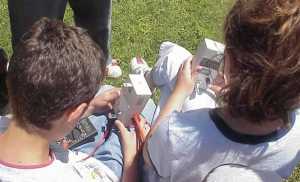
Figure 1. Students at Norfork Elementary School, Norfork, Arkansas, USA, make simultaneous measurements with two GLOBE sun photometers. |
1. Calibration of GLOBE water vapor instruments (see Figure 1);
2. Comparisons of two GLOBE sun photometers;
3. Solar radiation monitoring in support of GLOBE ONE.
The first two of these collaborations use handheld instruments designed specifically for the GLOBE Program, based on the original work with using light emitting diodes as spectrally selective detectors of sunlight done by Co-Principal Investigator Forrest Mims [Mims, 1992]. Each of these collaborations has produced high-quality results that are summarized below. So, from a science perspective, the collaborations have been, and continue to be, very successful. From a GLOBE implementation perspective, participating teachers have provided some interesting insights into how they have approached these collaborations, why they felt them worth doing, and what benefits their students have received.
The GLOBE water vapor instrument is based directly on the concept first published by Forrest Mims [Mims, 1992], and supported more recently by the National Aeronautics and Space Administrations Langley Research Center. As is true for all atmospheric monitoring instruments, calibration procedures are extremely important. This instrument uses two near-infrared detectors to measure direct sunlight; it is physically identical to the GLOBE visible-light sun photometer except for these detectors. One detector (IR2) responds to a range of wavelengths centered around a major water vapor absorption band. Ideally, the other detector (IR1) responds to radiation over a range of nearby wavelengths that are not affected (or much less affected) by changes in water vapor. Because cost is an important issue for GLOBE instruments, some compromises must be made. The detector over the water vapor absorption band around 940 nm uses a filtered photodiode which costs about US$17. The other detector is a near-IR LED which overlaps a smaller water vapor absorption band, but which costs about one-tenth as much as a filtered photodiode.
The ratio of the responses of these two detectors, IR2/IR1, can be related to the total amount of water vapor in the atmosphere between an observer and the sun. In principle, it is possible to provide an absolute calibration for such an instrument, based on modeling radiative transmission properties of the atmosphere and a careful analysis of the spectral and electronic performance of each instrument. However, this is an entirely impractical approach for large numbers of GLOBE water vapor instruments.
An alternative approach is to develop a relationship between the IR2/IR1 ratio and known amounts of water vapor in the atmosphere. There are two readily available sources of water vapor data: the National Aeronautics and Space Administrations global AERONET sun photometer network (see aeronet.gsfc.nasa.gov) and the National Oceanic and Atmospheric Administrations GPS-MET network (see gpsmet.fsl.noaa.gov/realtimeview/jsp/rti.jsp). AERONET uses the absolute calibration method mentioned above; this is justified for AERONET sun photometers because of the relatively huge investment in the instruments themselves (about US$25,000 each) and their supporting infrastructure, based at the NASAs Goddard Space Flight Center. AERONET instruments are distributed globally, but there are very few active GLOBE schools close to AERONET sites.
NOAAs GPS-MET network and other related networks make use of the fact that radio signals from global positioning satellites are delayed as they pass through the atmosphere, depending on the amount of water vapor in the atmosphere. There are a few hundred of these sites deployed around the United States. There may be some equivalent programs in other parts of the world, but the availability of data is unknown.
The Science Team asked Richard Roettger, a teacher at the Ramey School, Aguadilla, Puerto Rico, USA, to calibrate three water vapor instruments because of the proximity of his school to the GPS-MET site at Isabela, PR, less than 9 kilometers away and within 10 m of the same elevation. The goal is to calibrate an instrument over as wide a range of PW values as possible. PW values are, by convention, expressed as the amount of water directly overhead at an observers site. However, the instruments response is determined by the total amount of water vapor between the observer and the sun, expressed as the relative air mass times the amount of water vapor directly overhead. (See the GLOBE Aerosols Protocol for a discussion of relative air mass.) In Puerto Rico, So, although PW values vary with weather and (often) with the seasons, the best way to calibrate an instrument over a wide range of PW values is to collect data over a wide range of sun angles. At the Puerto Rico site, water vapor rarely falls below 2 cm of H2O (directly overhead), which limits the minimum range of PW values over which a calibration can be done. Thus, it might be reasonable to restrict the use of instruments calibrated here to sites with similar climates. A summary of the resulting calibrations is presented in Figure 2(a).
 |
| Figure 2(a). Calibration data for three GLOBE water vapor instruments. |
 |
| Figure 2(b). Comparison of GLOBE PW data with GPS data from calibration source. |
It is significant that the slope of the regression lines for these calibrations, which is determined by the spectral response of the detectors, is essentially identical for all three instruments. The intercept of the calibrations, which is determined by the electronic gain of the instrument, is the only significant variable among instruments. This means that a single calibration constant, the intercept, can be used to characterize each instrument.
The quality of the calibrations is clearly evident in Figure 2(b). This shows GPS and GLOBE data in the months following the collection of the calibration data. The PW values derived from the GLOBE water instrument continue to track closely the GPS data. The agreement is remarkable, considering that the GPS values are averages over 30 minutes taken from a large and unknown portion of the sky around the site rather than along the direct atmospheric path between the observer and the sun. Mims [2002] has found similarly good agreement among LED-based water vapor instruments and other sources.
Data collected by Wade Geery, a science teacher at Norfork Elementary School, Norfork, Arkansas, USA, and his students provide an important opportunity to monitor the performance of GLOBE sun photometers in the field. It is unusual for a GLOBE school to have two sun photometers and a reliable and well-established data collection program that allows side-by-side comparisons of two sets of measurements taken at nearly the same time. Figure 1 showed two Norfork students collecting data. (Other students, not shown in this picture, are simultaneously recording times and metadata.) The sun photometer on the left (RGK-512) was made by Mr. Geery from a kit and requires a separate digital voltmeter to read its output. The one on the right, with a built-in digital panel meter, (CAL-012) was provided through NASAs CALIPSO program. The CALIPSO instruments and most newer pre-assembled GLOBE sun photometers have an internal case temperature sensor to discourage their use when the detectors are too hot or too cold. Other than that, the instruments and their detectors are identical.
Although students (and adults) tend to think that any electronic measuring instrument, especially one with a digital output, must give the right answer, this is not necessarily true! The raw voltage readings from GLOBE sun photometers must be processed and interpreted based on calibrations applied to each instrument. Sun photometer calibrations involve many assumptions about the properties of the instrument and how solar radiation travels through the atmosphere to the instruments detectors [Brooks and Mims, 2001]. Because of the way the mathematics works for calculating AOT, small errors in voltage measurements can produce what appear to be disproportionate errors in AOT. For GLOBE sun photometers, the absolute accuracy for AOT data collected under ideal conditions is on the order of ±0.01-0.02 AOT units. For clear skies, with AOT values below 0.10, this represents a sizeable error! However, even professional sun photometers, such as are used in the AERONET network, have estimated errors only slightly better than this perhaps less than ±0.01 AOT units but not an order of magnitude better.
Figure 3(a) shows a series of measurements taken in 2005 by students from Norfork Elementary School. Figure 3(b) shows the relationship between AOT values from each instrument on all occasions for which nearly simultaneous measurements (within a few minutes) where taken with both instruments.
 |
| Figure 3(a). Near-simultaneous AOT values from two GLOBE sun photometers. |
 |
| Figure 3(b). AOT values, CAL-012 vs. RGK-512. |
| Table 1. Descriptive statistics
for differences between two GLOBE sun photometers, RGK-512 minus CAL-012. | ||
| Statistic | Green Channel | Red Channel |
| N | 145 | 145 |
| Mean | -0.00087 | 0.00283 |
| standard deviation |
0.00796 | 0.00605 |
 |
| Figure 4(a). Insolation at Waterloo Central Middle School. |
 |
| Figure 4(b). Comparison of insolation at Waterloo CMS and the University of Northern Iowa, Cedar Falls, IA. |
In keeping with GLOBE requirements for using inexpensive instruments, this project uses Model PYR pyranometers from Apogee Instruments, which cost about US$140 each. They use silicon solar cell detectors instead of the thermopile detectors found in much more expensive pyranometers. Solar-cell-based pyranometers are widely used in agricultural applications and their performance has been studied extensively. It is possible to build solar-cell pyranometers identical in principle to commercial instruments for less than US$20 [Brooks, 2004].
Figure 4(a) shows shows the insolation for 17-24 March, 2005, at Waterloo Central Middle School. The values in boxes show the maximum and daily average insolation. Noise in the data indicates the presence of clouds. During this time span, 21 March was the clearest day. The data on 23 March most likely show the effects of solar radiation reflecting off the sides of large cumulus clouds.
Although these instruments have limited absolute radiometric accuracy, they are entirely adequate for looking at variability in insolation. Direct measurements of spatial and temporal variability on the ground are essential for interpreting space-based measurements that are used to infer radiation at the ground. A typical sun-synchronous orbit such as followed by NASAs Terra, Aqua, and Aura spacecraft, for example, passes views a site for just a few minutes a few times a day, and the field-of-view of their instruments at Earths surface may be as large as 10s of kilometers on a side. With these viewing limitations, it is difficult to understand and separate spatial and temporal variability of the scene observed within an instruments ground footprint.
Daily insolation data collected at one-minute intervals provide detailed information about the variability in insolation and, indirectly, about cloud cover and even cloud type. (See, for example, Duchon and OMalley [1999].) The availability of two pyranometers separated by a few kilometers provides an unusual opportunity to look at both spatial and temporal variability of solar radiation. Figure 4(b) shows data from these two sites on 20 March, 2005. The motion of cloud fields between these two sites is clearly visible. Although clouds can often form and dissipate on a time scale of a few minutes, it is difficult to interpret the insolation data starting at about 930 minutes (15:30 CST) as anything other than the effects of the same cloud pattern passing over both stations. According to these data, the clouds have moved from 10 km from East to West in about 380 seconds, which gives a ground speed of about 26 m/s (about 58 m/h). On 20 March, the surface winds at the University of Northern Iowa were light and variable throughout the day, so this calculation is somewhat suspect. The most likely cause for concern is the internal data logger clocks at the two locations; if they were not set carefully to the same reference time (using a GPS receiver or www.time.gov, for example), then the time differences (and derived direction and speed) are not necessarily accurate. In any case, this work demonstrates the potential for collecting data that are extremely important for understanding spatial and temporal variability in solar irradiance over relatively small areas.
As is often the case with science data, the presentation of selected results here masks the amount of effort required to obtain a result that can be summarized in a graph or two. First of all, collaborators must establish a working relationship. Goals and procedures must be specified clearly. It takes longer to do this when the backgrounds, experiences, and goals of collaborators vary greatly. Inevitably, points that seem perfectly clear to one collaborator are not at all obvious to another collaborator. Developing a comfortable relationship is especially important and time-consuming when collaborations are conducted at a distance, with most communications conducted through the impersonal medium of e-mail.
How might these collaborations relate to future successful collaborations? Here are some questions posed to participating teachers and a summary of their responses.
1. Why did you undertake this collaboration?
Teachers wrote:
"The original reason to get involved... [was] to give students and me experiences with real science applications. Our science curriculum lacks this type of experience. Most of the labs and projects from the text are very low level and not related to the students world around them. I feel that students need to collect real world data that can be analyzed and hopefully impact their environment and world."
"I can build upon [students] curiosity about relationships, I can stress following protocols and the importance of understanding where inaccuracies enter into the scientific process. Most importantly, students can experience authentic data collection, as opposed to canned samples."
"I am very interested in allowing my students the opportunity to experience real time science and real life science. This collaboration allowed my students to become involved with science and be able to take ownership of a project that they could both feel good about doing and also learn something from."
"As students get involved with these kinds of projects they see the different types of careers available to them and might help them get engaged with the science and math classes to prepare them for these careers. I am their teacher of math and science, not a scientist or mathematician. Working on projects with scientists and other experts is a great way to get them to see what they might want to become. Textbooks just don't do this."
An inescapable conclusion from these comments is that, for educators, the process of the collaboration is more important than its content. Note that in these and other quoted comments below, it is not possible to tell which project the respondent is talking about. To the extent that this is the opposite of a scientist's perspective, it is important to account for these differing perspectives when designing student/teacher/scientist collaborations.
2. What aspects of this collaboration kept you and your students engaged?
It is clear that an essential part of a successful collaboration is prompt communication and feedback. One teacher wrote: "I have had students doing research with other scientist/mentors that have not been very prompt with feedback and students lost interest." Another wrote: "I was... reporting data [and] self-training myself and my students on the written protocol. Thus, I really needed the early correspondence to get a perspective for the reasonableness of our data and the troubleshooting of technique and equipment. This was most beneficial in my experience."
3. What are some of the obstacles you encountered?
Although this observation has risen to the level of a cliché, it remains worth noting that, as described by one teacher: "There is lots of pressure on teachers to have their students do well on the standardized tests. These tests are not aligned with standards of collecting good data and analyzing the data to draw conclusions or defend scientific arguments. So teachers tend to spend more time on what will be tested ..."
Another teacher noted that: "Peer pressure among teachers is so pervasive that no single teacher in a larger school district dare attempt to do more... Mediocrity reigns because so few teachers are willing to take on more activities, struggle with the administration for resources, and alienate his peers in the process."
The conventional wisdom for prospective GLOBE teachers is that working alone on GLOBE activities, without support from colleagues, will be an obstacle to successful implementation. However, one common feature of the collaborations discussed here is that each of them has involved a single teacher.
Teachers wrote:
"...it's the 'true believers' in the academic community that get GLOBE started and keep it going.
"Most of the science and math teachers do not have built-in time to collaborate. They get caught up in their own classroom with very little sharing."
"It has worked best for me when I am the only teacher coordinating data entry. It would be great to have others involved in the data collection, but it there would need to be cooperation as to who entered what data what days."
4. What is the pedagogical value to your students?
It is interesting that none of the participating teachers tied the content of their collaboration to specific standards-driven science content areas, although this was certainly possible for all three projects. Responses were remarkably free of the jargon "inquiry-based" vs. "direct instruction," "alignment to standards," etc. that permeates science education literature (and the funding agencies that support education research). In each case, the teacher's emphasis was simply on providing a realistic window onto the science process rather than on science content. One teacher wrote: "Except for the time we study weather in the fall, there is no direct link to the curriculum other than data analysis. I do believe that [data analysis] is also an important ongoing part of their curriculum... I would not necessarily say that I am a better teacher because I worked on this project. I think allowing my students to work on projects such as this allow them to become better students and hopefully life long learners."
Recalling one teacher's comment about being a teacher and not a scientist (see item 1, above), we conclude that perhaps the greatest indirect pedagogical value of these collaborations lies in giving self-described "non-scientists" a framework within which to undertake projects that would normally lie outside of their professional experience. Each of these projects required efforts considerably beyond what is required to "teach" science, at least in the way that is still typical in U.S. classrooms. When educators take responsibility for doing some of what scientists actually do they can, in fact, provide realistic models for their students to observe and emulate regardless of how they describe themselves.
In conclusion, it is worth noting that each of these collaborations is still generating data. It seems clear that the important science need for ongoing data has been achieved because the process in which students are participating remains important regardless of what science topic is being taught in the classroom.
Brooks, David R. (online documents, 2004-2005) http://www.pages.drexel.edu/~brooksdr/DRB_web_page/Solar/Solar_home_page.htm http://www.pages.drexel.edu/~brooksdr/DRB_web_page/construction/pyranometer/pyranometer.htm
Brooks, David R., Forrest M. Mims III, Arlene S. Levine, Dwayne Hinton. The GLOBE/GIFTS Water Vapor Monitoring Project: An Educators Guide with Activities in Earth Sciences. National Aeronautics and Space Administration, EG-2003-12-06-LARC, 2003. Online at http://www.pages.drexel.edu/~brooksdr/DRB_web_page/papers/LaRCWV/LaRCdoc.htm
Brooks, David R., and Forrest M. Mims III. Development of an inexpensive handheld LED-based Sun photometer for the GLOBE program. J. Geophys. Res., 106(D5), 4733-4740, 2001.
Duchon, Claude E., and Mark S. OMalley. Estimating Cloud Type from Pyranometer Observations. J. Appl. Meteor., 38, 132-141, 1999.
Lemone, et al. (other authors unknown at this time). GLOBE ONE an Overview. Ninth Annual GLOBE Conference, Prague, Czech Republic, 31 July 05 August 2005.
Mims, Forrest M., III. An inexpensive and stable LED Sun photometer for measuring the water vapor column over South Texas from 1990 to 2001. Geophys. Res. Lett.. 29, 20-1 through 20-4, 2002.
Mims, Forrest M. III. Sun photometer with light-emitting diodes as spectrally selective detectors. Appl. Opt., 31, 6965-6967, 1992.