What is a pyranometer and what is it good for?
David Brooks
Institute for Earth Science Research and Education
What is a pyranometer and what is it good for? | |
David Brooks |
There are two kinds of pyranometers. The expensive kind uses a collection of thermocouples called a thermopile. (A thermocouple generates a small voltage difference when the two junctions of the thermocouple are at different temperatures.) A much less expensive kind uses small silicon-based photodetectors; these are nothing more than very small solar cells. Because these less expensive detectors do not respond uniformly to input across the solar spectrum, they might be referred to as "surrogate" pyranometers. Despite their limitations, they are widely used for agricultural and environmental monitoring and other applications when very high absolute radiometric accuracy is not required.
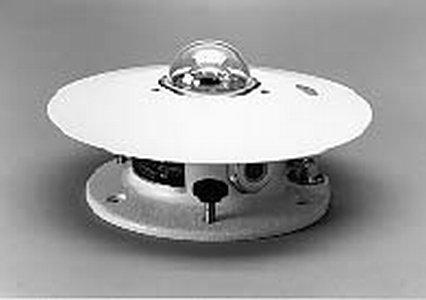 |  |  |
| Eppley precision thermopile pyranometer, Eppley Laboratory, Inc. | Apogee solar cell-based pyranometer, Apogee Instruments, Inc. | "Homemade" solar cell-based pyranometer. |
 |
| Earth from space, May, from NASA "Blue Marble" monthly images. |
 |  |
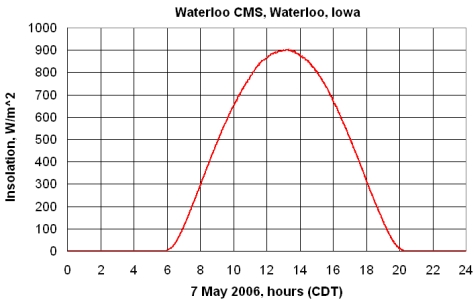 |
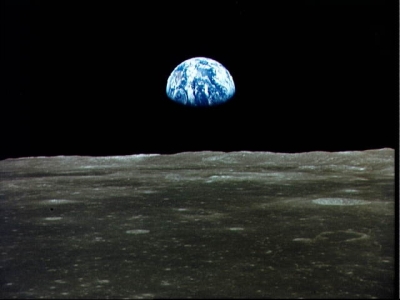
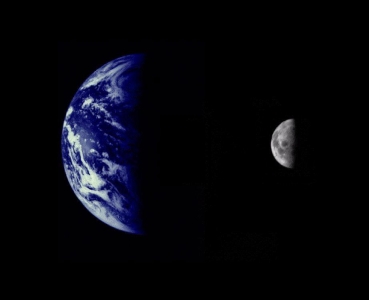
| Apollo 11: Earthrise over the lunar horizon (July 16, 1969), NASA. | Mariner 10: Earth and Moon (November 3, 1973), NASA/JPL. | Insolation varies during the day (a cloud-free day in Iowa). |
Clouds affect the amount of sunlight reaching Earth's surface, although not always in the way you might expect! Air pollution and particulates suspended in the atmosphere can also affect the amount of sunlight.
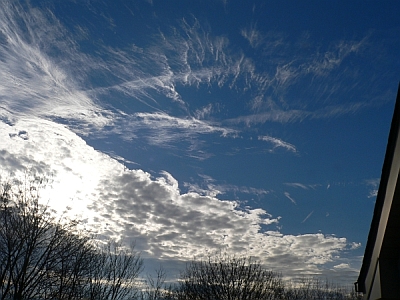 | |
| Cirrus and altocumulus clouds over IESRE, Winter 2006. | Clear and partly cloudy days in Iowa. The boxed values give the maximum and daily average insolation. When sunlight is reflected off the sides of clouds, instantaneous insolation can be greater than for cloud-free conditions. |
The maximum amount of sunlight reaching Earth's surface varies with the seasons. More sunlight reaches the surface in summer than in winter because the maximum solar elevation angle is lower in the winter.
 | 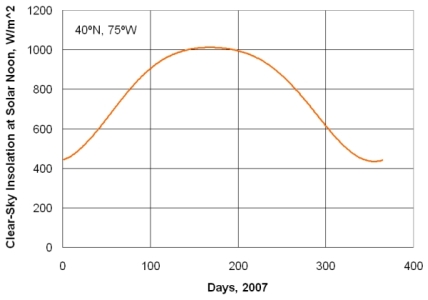 |
| Winter sun at IESRE casts long tree shadows even near noon. | Maximum clear-sky insolation at solar noon near IESRE's longitude and latitude. |
Changes in air quality and cloud cover are reflected in changes in sunlight reaching Earth's surface. Accurate long-term pyranometer measurements can tell scientists a great deal about climate changes. However, it is difficult and expensive to make long-term pyranometer measurements that are accurate enough to allow small changes to be detected.
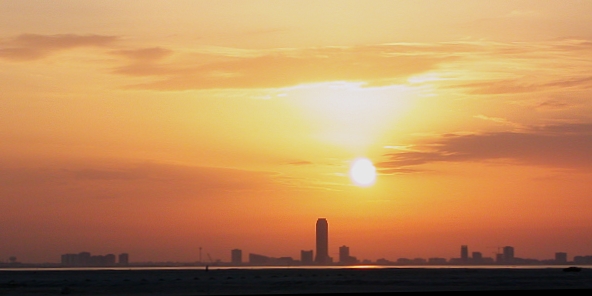 |  |
| Sunset over Manama, Bahrain. The red sky indicates the presence of suspended particulates (wind-blown sand and urban air pollution) in the atmosphere. |
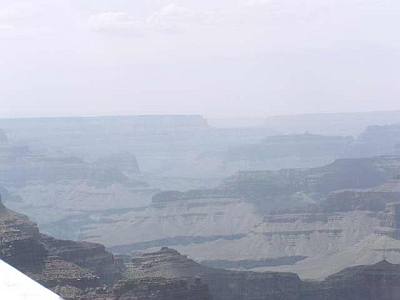
View of air pollution over Grand Canyon, from Yavapai point, elevation 7084 feet (2159 m) at the Grand Canyon, 21 May 2007, visibility 31 miles (50 km), National Park Service, U.S. Department of the Interior. |
Many students (and adults!) do not understand the basic facts about what causes the seasons: Earth rotates around the sun once every 365.25 days. The tilt of Earth's rotational axis is responsible for seasons. Earth's surface receives less sunlight in the winter than in the summer. Winter and summer are reversed in the northern and southern hemisphere.
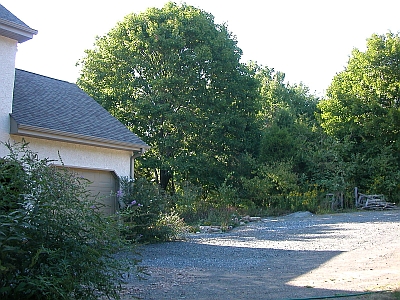
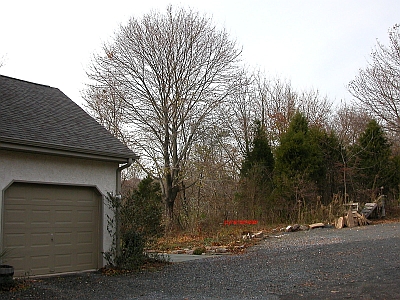
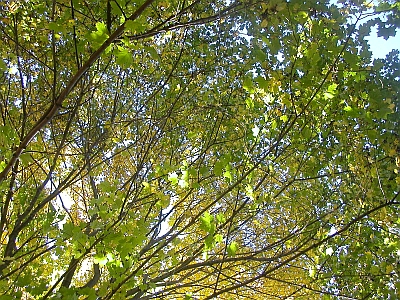
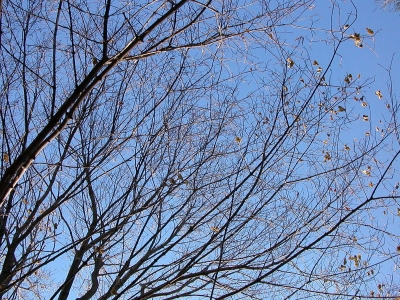
In temperate climates, the seasons are accompanied by changes in deciduous vegetation. By placing a pyranometer under a tree canopy, you can observe and measure these changes. In these images, a camera is pointed straight up from a pyranometer site installed under a large Norway maple tree. The images were taken in early and late fall, after leaf drop. In the winter image, the pyranometer site is barely visible just above the (illegible) "pyranometer" caption in the image.
 |
 |
 |
 |
A pyranometer is normally leveled to measure the total solar energy reaching a horizontal plane at Earth's surface. For studying the potential solar power available at a particular site, the pyranometer could be mounted at the same orientation as a solar panel would be mounted, on a south-facing roof, for example (in the northern hemisphere). The tilt and north-south orientation of a photovoltaic panel are important factors in determining its potential performance. With more sophisticated installations, it may be possible to vary the tilt of a solar panel, either manually or with a motor, to change its orientation to the sun as a function of the seasons. Some interesting science fair projects could follow from considering the siting and orientation of solar power panels.
As noted above, insolation data provide considerable insight into changing cloud patterns. Data recorded at one-minute intervals provide detailed, interesting, and very valuable records of day-to-day weather patterns. As a result of climate change, these patterns may change over time.
A pyranometer site is relatively easy to maintain. However, it does require some thought. It must be set up in a place appropriate for its use.
The pyranometer's detector surface must be cleaned regularly. A data logger must be protected from the weather and it must be downloaded and relaunched
periodically, according to a pre-determined schedule. The data must be archived and analyzed. A log book should be kept to record activity and
any problems with the site. These kinds of requirements are applicable to many kinds of science experiments.
They teach students about the science process and provide opportunities for students with
a wide range of academic abilities and interests to participate. Here is what one elementary school teacher in Arkansas has to say about his pyranometer site:
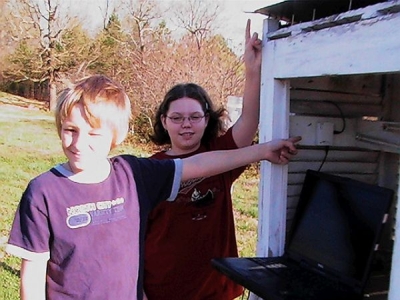 |
| Wade Geery's 5th grade students point to their pyranometer and data logger at their weather station (photo by Wade Geery). |