Pyranometer Protocol
David BrooksInstitute for Earth Science Research and Education
January, 2008
Pyranometer ProtocolDavid BrooksInstitute for Earth Science Research and Education January, 2008 |
If you have questions about this protocol, please contact David Brooks at IESRE.
Participants purchase or build an inexpensive instrument for measuring solar energy (a pyranometer). They measure the total amount of solar energy reaching a horizontal plane at Earth's surface (insolation). When used with a data logger, a pyranometer provides a continuous record of solar insolation and provides insights into solar power, the atmosphere, weather, seasonal changes, and climate.
The pyranometer protocol is suitable for older elementary through secondary grades. It can be integrated with general science, Earth and environmental science, physics, and biology curriculums.
The pyranometer protocol requires a site with a 360° view of the horizon free from major obstructions, where a small instrument can be securely and permanently mounted, and safely accessed. Surface reflectance measurements require access to several surface types, such as grass, bare soil, and concrete.
*Approximate prices as of summer, 2007. Quantity pricing may apply.
The purpose of this protocol is to explore some basic interactions between Earth and the sun. This topic is important because sunlight is the ultimate fuel source driving the Earth/atmosphere "engine." Most obviously, solar energy and its daily and seasonal variability provide the driving force for weather and climate.
Even the youngest students are taught to make simple weather observations and to answer questions such as, "Has it been raining?"; "How cloudy is it this morning?"; "How hot will it be today?" Basic qualitative observations can lead to quantitative measurements and more sophisticated questions: "How much rain have we had this month, and is that more or less than average?"; "What is the percentage of cloud cover and what kinds of clouds are present?"; "Is it getting warmer where we live?" ; "Why does the atmosphere appear hazy and what does this have to do with weather and climate?" These kinds of questions are of interest to students and others because, like sunlight, they are closely bound to our daily experiences and relate to issues of climate change that will dominate Earth science in the 21st century.
As a first step toward studying sun/Earth/atmosphere interactions, consider how Earth and its atmosphere are maintained in radiative balance with energy from the sun. These dynamic processes are illustrated conceptually in Figure 1, some version of which is invariably found in Earth science texts often used in 8th and 9th grade courses [e.g., Allison et al., 2006]. There is a great deal of science embedded in such images, much of which is no doubt obscure to non-specialists.
Earth and its thin and fragile blanket of atmosphere form a dynamic, interconnected system. Incoming sunlight is reflected, scattered, and absorbed by Earth’s atmosphere and its surface. Different surfaces, including cloud top "surfaces," reflect and absorb sunlight in different ways. Oceans absorb almost all the radiation incident upon them. New snow reflects nearly all radiation. Whatever the surface, absorbed radiation is ultimately re-emitted as longwave thermal radiation.
Earth's yearly journey around the sun and its daily rotation about an axis that is tilted relative to its orbital plane keeps Earth and its atmosphere in a constant state of flux driven by diurnal and seasonal ooling and heating. On average, this ongoing process of absorption and re-emission keeps the Earth/atmosphere system in the radiative balance that is required by basic physical laws. The details about the processes summarized in Figure 1, are what fascinate atmospheric and Earth scientists. Although the explanations can sometimes be complicated, atmospheric and Earth sciences still rely heavily on observation. Many observations and quantitative measurements of the atmosphere, including the pyranometer measurements described in this protocol, are easy to make and are not difficult to understand.
 |
| Figure 1. Schematic representation of Earth's radiative balance. [Figure by Vivek Dwivedi, NASA Goddard Space Flight Center.] |
Stars generate huge amounts of energy through the process of nuclear fusion, in which hydrogen is converted into helium. Earth's sun, an unremarkable medium-sized star, produces a total power P of about 3.9 × 1026 watts (W). T his power is radiated into space uniformly in all directions. Fundamental physical laws tell us that the intensity of a point source of radiation decreases as the inverse square of the distance from the source—at planetary distances the "point source" approximation is a very good approximation indeed for the sun. The solar constant So is defined as the power per unit area of solar radiation falling on the surface of an imaginary sphere of radius R around the sun:
So = P/(4π R2) = P/(4π•150,000,000,0002) ≈ 1370 W/m2 where R is the average Earth/sun distance (1 astronomical unit or 1 AU), about 150,000,000,000 m. The solar output actually fluctuates a little. More importantly, the solar "constant" varies by about ±3.4 percent during a year because Earth is in a slightly non-circular orbit around the sun. The maximum and minimum values occur at perihelion and aphelion —- the minimum and maximum Earth/sun distances: Smax = So/(1 - e)2 = So/(0.983)2 = 1417 W/m2| Spectral Letter | Temperature Range, K | Stellar Color |
|---|---|---|
| O | >30,000 | Blue |
| B | 10,000 – 30,000 | Blue |
| A | 7,500 – 10,000 | Blue-white |
| F | 6,000 – 7,500 | White |
| M | 5,000 – 6,000 | Yellow-white |
| G | 3,500 – 5,000 | Orange |
| K | <3,500 | Red |
 |
| Figure 2. The extraterrestrial solar spectrum with Planck's law blackbody radiation for a temperature of 5800 K superimposed. [PlancksLaw.xls] |
Recalling Figure 1, not all of the extraterrestrial radiation reaches Earth's surface. Some of it is absorbed and some of it is scattered and reflected back to space. Figure 3. shows a typical distribution of solar radiation at Earth's surface. It consists of two components—radiation directly from the sun and diffuse radiation from the sky. Direct radiation is by far the biggest component, but the diffuse radiation is still significant.
 |
| Figure 3. Direct, diffuse, and total insolation for a standard atmosphere, with relative air mass of 1.5. |
It is evident from Figure 3 that the effect of the atmosphere on solar radiation is not uniform across the solar spectrum. There are several prominent "holes" in the radiation. These are due to the composition of the atmosphere, as described in the next section.
Earth's size and density, and its average distance from the sun, have produced a fortuitous set of circumstances for supporting life as we understand it. Earth's gravity keeps in place an oxygen-rich atmosphere. The average Earth surface temperature (about 16°C), as controlled by the solar constant and the greenhouse effect of the atmosphere, allows water to exist naturally in all its three phases -- solid, liquid, and gas. Although it is almost certainly a mistake to assume that Earth provides a unique environment for the development of life (especially considering that scientists have found primitive life in Earth environments that seem too hostile to support life), it is certainly true that conditions supportive of a permanent oxygen-rich atmosphere and abundant water for most of Earth's long history have made possible the development of advanced forms of life as we understand them.
The atmosphere is made up almost entirely of gases, predominantly nitrogen and oxygen. Table 1 gives the composition of pure dry air near Earth's surface.
| Gas | Percent by volume (dry air) |
Cumulative percent by volume |
|---|---|---|
| N2 | 78.08 | 78.08 |
| O2 | 20.95 | 99.03 |
| Ar | 0.934 | 99.964 |
| Other trace gases | .036 | 100.000 |
Actual atmospheres contain other naturally occurring and anthropogenic (human-produced) components, as shown in Table 2 [American Chemical Society, 2000].
| Component | Approximate percent by volume (parts per million, ppm) |
|---|---|
| Water (H2O) | 0 – 4% |
| Carbon dioxide (CO2) | 0.037% (370 ppm) |
| Methane (CH4) | 0.00017% (1.7 ppm) |
| Nitrous oxide (N2O) | 0.00003% (0.3 ppm) |
| Ozone (O3) | 0.000004% (0.04 ppm) |
| Aerosols (liquid and solid particles) | 0.000001-0.000015% (0.01-0.15 ppm) |
| Chlorofluorocarbons (CFCs) | 0.00000002% (0.0002 ppm) |
Although the total amount of these trace components seems very small, except perhaps for water vapor, their effects on the Earth/atmosphere system are profound. The main contribution is the greenhouse effect—the process whereby some trace gases and aerosols in the atmosphere absorb and re-radiate solar radiation, thereby warming Earth's surface and at least the lower part of its atmosphere.
It is not difficult to quantify the overall effect of Earth's surface and atmosphere (including clouds) on solar radiation. Consider the solar radiation striking Earth. The area of Earth's disk as viewed from space is
area = (πr2) km2
where r is Earth's radius, about 6,378,000 m. Energy from the sun, equal in intensity to the solar constant, is intercepted by Earth's disk, so the total energy incident on Earth is
incident energy = (πr2)So
Not all the incident energy is absorbed because the Earth/atmosphere system reflects part of the energy back to space. The albedo A of the Earth/atmosphere system is the fraction of incoming solar radiation that is reflected by the Earth/atmosphere system, about 0.3. So, the energy absorbed by the Earth/atmosphere system, as viewed from space, is
absorbed energy = (πr2)So(1 - A)
Basic physical laws require that bodies must be in radiative equilibrium. That is, whatever energy is absorbed must be re-emitted in some form. The solar energy striking Earth's disk as viewed from space is re-emitted as thermal radiation by the surface of the entire globe, in an amount proportional to the fourth power of the temperature, as described by the Stefan-Boltzmann Law:
emitted energy = (4πr2)σT4
where 4πr2 is the surface area of Earth and σ = 5.67x10⁻⁸ W/(m2K4) is the Stefan-Boltzmann constant. Set the absorbed energy equal to the emitted energy:
(πr2)So(1 - A) = (4πr2)σT4
Solving for T yields:
T = [So(1 - A)/(4σ)](1/4) = [1370•(1-0.3)/(4•5.67x10-8)](1/4) = 255 K
0ºC = 273 K. So, the temperature at which the Earth/atmosphere system is in radiative equilibrium is about -18ºC. This is very cold from a human perspective—far below the freezing point of water. But, the average Earth surface temperature is about 16ºC, certainly a more pleasant value from a human perspective. The greenhouse effect accounts for the difference of about 34ºC. Although the temperature of the Earth/atmosphere as viewed from space must still be -18ºC, greenhouse gases warm the lower atmosphere by absorbing some emitted radiation and re-radiating it back to Earth's surface.
A very simple way of accounting for the greenhouse effect is to modify the radiative balance equation:
4σT4(1 – x) = So(1 - α)
where "x" is a "greenhouse factor" that provides a measure of how much radiation is absorbed by the atmosphere and re-radiated down to Earth's surface, rather than out to space. For x=0, there is no greenhouse effect. For Earth, a value of x=0.4 produces an equilibrium temperature for the Earth/atmosphere system of about 16°C.
As noted above, the greenhouse effect is essential to support life on Earth. Although there have been large swings in Earth's climate (and its average temperature) during its long history, the rate of global changes have been slow enough to allow many life forms to adapt.
Figure 4 shows the effect of modifying the greenhouse parameter. For Earth, a greenhouse factdor of about 0.4 gives an average global surface temperature near 16°:C, what is actually observed. Raising the greenhouse parameter, by increasing the ability of the atmosphere to absorb infrared radiation, eventually leads to a "runaway greenhouse effect" such as exists on Venus.
 |
| Figure4. The effect of changing the atmosphere's greenhouse parameter. |
Even small changes in the concentrations of trace gases responsible for the greenhouse effect can change both the overall climate and the rate of its change. If the rate of change is too rapid, then species may not be able to adapt; this is the primary source of concern about human-induced changes in greenhouse gases. Table 3 shows the relative efficiency of some greenhouse gases [American Chemical Society, 2000]. CO2 is arbitrarily given an efficiency of 1.
| Greenhouse gas | Relative effectiveness |
|---|---|
| Carbon dioxide (CO2) | 1 (arbitrarily assigned) |
| Methane (CH4) | 30 |
| Nitrous oxide (N20) | 160 |
| Water (H2O) | 0.1 |
| Ozone (O3) | 2000 |
| Trichlorofluoromethane (CCl3F) | 21,000 |
| Dichlorodifluoromethane (CCl2F2) | 25,000 |
Water vapor is the most prominent greenhouse gas, and its relatively low greenhouse effect efficiency is overridden by its much higher concentration in the atmosphere. Carbon dioxide is also a potent greenhouse gas even at the concentration shown in Table 2. CO2 has both natural and anthropogenic sources, and is of great concern because steadily increasing CO2 levels due to the burning of fossil fuels since the start of the Industrial Revolution are generally believed to be warming Earth's climate more quickly than at any time in the known past.
The most notorious trace gases belong to the family of chemicals known as chlorofluorocarbons (CFCs). These have no natural sources and have entered the atmosphere only as the result of human industrial activity -- because of their chemical stability, they have been used as coolants and propellants in spray bottles. In addition to being potent greenhouse gases, and even at what appears to be miniscule concentrations, CFCs are primarily responsible for dramatic seasonal reductions in concentrations of stratospheric ozone in the upper atmosphere (the now-famous "ozone holes"). T his is a problem because stratospheric ozone is "good ozone" that protects Earth's surface from ultraviolet (UV) radiation that can have harmful effects on humans and other organisms. (The "bad ozone" near Earth's surface, which is a pollutant that can cause serious health and environmental problems, is not affected in this way because it is produced locally as a result of photochemical processes at Earth's surface.)
Even seemingly small changes in the concentrations of the more potent greenhouse gases, especially if they occur quickly, have the potential to disrupt entire ecosystems that thrive only within a narrow range of environmental conditions.
It is not easy to measure all the processes that control the amount of sunlight reaching Earth's atmosphere. Measuring the concentrations of trace gases is notoriously difficult. However, some measurements are accessible to students and teachers. The total amount of aerosols and water vapor in the atmosphere (but not their vertical distribution) can be measured with handheld sun photometers. Protocols for those measurements are available here.
The pyranometer described in this protocol measures total insolation reaching Earth's surface, due to the combined effects of reflection, absorption, and scattering of incoming solar radiation. This value depends strongly on seasonal effects and cloud cover. Clouds are the primary contributor to the reflection of sunlight back to space before it reaches Earth's surface. It is much less strongly dependent on other atmospheric constituents, but the effects of aerosols and water vapor can sometimes be seen in pyranometer data. Global (or regional) "dimming" due to rising average levels of particulates in the atmosphere is a topic of current scientific interest. In some parts of the world, such as southeast Asia, persistently high levels of particulates due to dust from dry areas and nearly year-round agricultural burning significantly reduces the amount of sunlight reaching Earth's surface.
This protocol involves recording pyranometer data sampled at one-minute intervals. Very little such data are available anywhere in the world. It is more often the case that data are averaged over several minutes. Averaged data are sufficient for assessing the value of a site for generating solar power, for example, but much less useful for scientific studies. For example, pyranometer data at one-minute intervals can be used to generate statistical models of cloud patterns over a site. Over the long term, such data are important indicators of climate change.
Figure 3 shows eight days of pyranometer from a rural school in Arkansas, along with air temperature and relative humidity. These data show a typical spring mixture of clear and rainy days. The diamond-shaped symbols are solar noon insolation values calculated from a simple clear-sky insolation model. It may be surprising that on cloudy days, the instantaneous insolation can be larger than on a cloud-free day. This is because clouds reflect sunlight off their sides. This temporary increase in insolation is offset by shadowing when clouds pass over the sun. As a result, the maximum daily insolation occurs on the clear days, as shown in Figure 3.
Note that the peak insolation and total insolation on 1 April is slightly higher than on 8 April. This suggests that 1 April was an unusually clear with a frontal system moving across the site. The rapid drop in relative humidity on the morning of 1 April tends to support this suggestion. But, it is not possible to be sure what happened, in retrospect. A very worthwhile supplement to these data is photos taken in the same direction and at the same time, every day. Regardless of how many "numbers" are collected, visual evidence is always helpful for resolving questions and providing credibility and insight into unusual events.
The result of integrating insolation over an entire day is shown in Figure 4. "Integrating" the data means adding the insolation values for every minute. This gives the total daily insolation in W-min. To express this value in kW-hr, which is the unit you see on your monthly electric bill, divide by 60 min/hr and then by 1000 W/kW.
 |
| Figure 3. Pyranometer, temperature, and relative humidity data from Arrie Goforth Elementary School, Norfork, Arkansas USA. Data courtesy of Wade Geery. |
|
| Figure 4. Total daily insolation, kW-hr, 1-8 April. |
How do you know that the insolation values returned by your pyranometer are correct? More significantly, how do you calibrate a pyranometer that you build yourself? These are important questions without easy answers. One of the ongoing challenges for scientists interested in pyranometry is obtaining high-accuracy absolute radiometric calibration -- that is, an absolute measurement of how much insolation actually reaches Earth's surface at an observing site. This is a very difficult measurement that requires theoretical analysis and expensive research-quality equipment. For the pyranometers described here, there are two choices for calibrations. Pyranometers assembled by IESRE are calibrated against a commercial pyranometer (Apogee Instrument's PYR-P pyranometer.) This relatively inexpensive commercial instrument, in turn, is calibrated against much more expensive research-grade thermopile pyranometers.
If you build your own pyranometer a kit supplied by IESRE, you can return it for calibration. As a reasonable "free" alternative, a pyranometer can be calibrated by comparing its output on a cloud-free day with the predictions of the clear-sky insolation model mentioned above. As is evident from the data in Figure 3, this model should provide a reasonable calibration source for any site that has occasional very clear and dry days.
As indicated in the previous section, pyranometer calibration is a major issue. However, there is a very interesting measurement you can make that requires no absolute calibration. If you have two pyranometers, one looking straight up and the other straight down, the ratio of the output of the downward-pointing instrument to the output of the upward-point instrument is related to the reflectivity of the surface. If the output of one of the downward-point instrument is calibrated against the output of the other when both are pointing straight up, then the ratio of the relatively calibrated outputs is equal to the reflectivity of the surface:
With both instruments side by side, pointing up, calculate C: I2 = I1•C
Then with I2 pointing down
(I2•lC)/I1 = surface reflectivity.
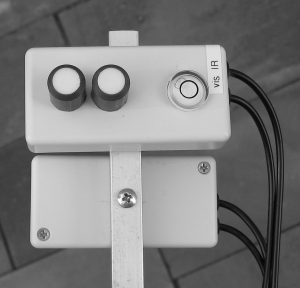
Figure 5 shows two pyranometers mounted on a 2-m length of square aluminum tubing. These pyranometers are modified versions of the instrument described in this protocol. Each pyranometer has two detectors -- one to measure total solar insolation (wavelengths between roughly 400-1100 nm) and the other to measure just the near-IR insolation (wavelengths between roughly 700-1100 nm). The near-IR detector is physically identical to the broadband detector, so they have identical housings.
To collect the data shown in Figure 5, the tube is held parallel to the ground, about 1 meter off the ground, and walked slowly across a flagstone patio, a gravel driveway, a grassy surface, and back. The output voltages are shown along with the reflectivities. The surfaces are very different, both in reflectivity and uniformity. The differences are greater in the near-IR than they are for the broadband measurement, but in either case it is not difficult to distinguish between the surfaces.
You can study the reflectivity of surfaces with two of the pyranometers described in this protocol. Reflectivity values should vary with surface type and the seasons. Reflectivity of bare soil and vegetated surfaces should vary with moisture content, too. If you would like to build a two-channel reflectometer as shown in Figure 5, please contact IESRE at the e-mail address given at the beginning of this protocol.
 |  |
| Figure 5. Surface reflectivity measurements. | |
Pyranometers are intended measure to measure all the solar radiation that falls on them. This includes direct light from the sun and indirect sunlight from the rest of the sky. So, they must be mounted at a location with a good view of the entire sky. Although it is usually not possible fo find locations that have absolutely no obstructions on the horizon, it is important to do the best you can to choose an appropriate site. A flat rooftop is a good choice if you can resolve whatever access issues might exist for such locations. If the terrain around your site is flat, with no nearby trees, you can use a ground site. The requirements for such a site are somewhat more restrictive than they are for siting a thermometer enclosure -- trees and buildings need to be farther away for the most accurate performance. If you have a good rooftop site, but access is difficult, it may be possible to purchase a USB extender cable that will let you access the data logger that records your pyranometer from a location up to at least 30 m away. This cable will cost around $75, so it is a significant additional investment for this project.
The other critical consideration for siting your pyranometer is that it must be mounted on a stable and level platform. Your IESRE pyranometer comes equipped with a built-in bubble level. An ideal mounting platform is 7 mm (1/4"+ aluminum plate or a 25 mm x 7 mm (1" x 1/4") bar. Wood, even plywood, is not a good choice because it will warp and be affected by the weather even if it is painted. If your mounting platform is stable, you should need to level your pyranometer only once when you install it. Thereafter, you could check the level occasionally to make sure nothing has changed. If you change the leveling of your pyranometer, you should note this in the log book that you keep for your pyranometer site.
Your IESRE pyranometer comes with an 8-32 machine screw for mounting the pyranometer case to its platform. It is possible to use a camera tripod as a mounting platform. Typically, tripods have a standard 1/4" x 20 mounting screw to which you can attach a platform that has a 1/4" x 20 (threads per inch) tapped hole. (If you are going to use such a mount, you can order a pyranometer from IESRE that has a 1/4" x 20 tapped hole in the case.) However, tripod mounts are temporary and they can be unstable in windy conditions, so they are not a good long-term solution. If you have questions about site requirements or setup, please contact IESRE.
Using Your Pyranometer | 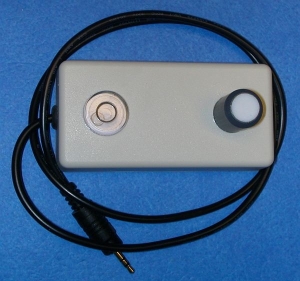 |
If you have assembled your own IESRE pyranometer, it will need to be calibrated. For serious long-term use, it is worth considering a commercial pyranometer that has already been calibrated by its manufacturer. Assembled and calibrated versions of IESRE's kit pyranometers are available, and you can also ask IESRE to calibrate your assembled pyranometer. The charge for calibration varies, depending on what kind of external funding support is available for this project at the time. If you have a commercial pyranometer, you can calibrate your IESRE pyranometer against this standard.
Why should you bother to have more than one calibrated pyranometer? If something goes wrong with one of your instruments, then you can rely on the other one until the problem is resolved. All instruments, including pyranometers, need routine re-calibration. If you have two or more instruments, you can afford to take the time to maintain instrument calibrations without interruptions in your data record. This is extremely important for data that should be continuous to have the most educational and scientific value! IESRE pyranometers are so inexpensive that you can and should have spares that are calibrated and ready for immediate installation whenever they are needed.
Pyranometers are rugged and trouble-free instruments. By design, they are intended to be permanently mounted outdoors and should require very little care. They only routine maintenance that you should need to do -- weekly or more often if there is a lot of wind-blown dust or other debris in the air at your site -- is to be sure the diffuser (the white disk on IESRE pyranometers) is clean. Wipe it gently with a soft lint-free rag or tissue. Never use detergents or any soap-based, alcohol-based, or abrasive cleaners on the diffuser.
Logging Your Data | 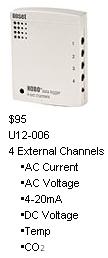 | 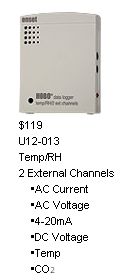 |
The U12 loggers cannot be used without Onset Computer Corporation's proprietary software, which works on both Windows and Mac computers — there is no way around this requirement. The HOBOware Lite software ($45 as of August 2011) is perfectly OK for this task. There is no reason to get the much more expensive HOBOware Pro software. However, The Pro version of the software can be downloaded for a 30-day free trial. Older "Greenline" software from Onset Computer Corporation will also work if you happen to have it, but it is no longer supported or available from Onset.
If you have purchased a pyranometer kit from the Institute for Earth Science Research and Education, it came equipped with a cable with a 2.5-mm stereo plug. This means that you do not have to buy a voltage input cable from Onset. This kind of plug is an absolute requirement for the U12 loggers. Do NOT substitute a 2.5-mm mono plug, as this will very quickly drain your logger's battery and possibly damage the logger!
If you are using some other kind of pyranometer, you need to supply an appropriate connector. 2.5-mm stereo cables can be purchased from Onset Computer Corporation, part number CABLE-2.5-STEREO, and spliced onto your pyranometer cable, or you can find other sources of 2.5-mm stereo plugs to attach to the end of your cable. These small plugs are difficult to work with, and it is easy to create unintended short circuits when you attach such a plug. If you do not have experience with this kind of work, it is worth purchasing an appropriate cable and/or pre-wired connector. Sometimes these are available cheaply from electronics suppliers such as dcables.net or All Electronics Corporation. It is often the case that, even though the plugs themselves are small, the housings are too large to fit more than one of them side-by-side in the U12 data logger jacks. One cable that will work is the Hosa CMM-510 from places like AVAlive.com. These are 10' cables, so you can cut them in half to make two cables.
Invariably, scientists prefer Universal Time (UT) as a time reporting standard because this time system does not depend on time zones and the presence or absence of Daylight Saving Time. However, when viewing pyranometer data, there are benefits to displaying the time axis as local time. Also, the data loggers specified for this project have an internal clock that is set from your computer's clock whenever you start data recording. Modern computers are almost always automatically set according to your time zone and automatically change to and from Daylight Saving Time. So, it is easy simply to use local time as the time reporting standard for this measurement. Note, however, that computer clocks are not always very accurate. They can "drift" by variable amounts depending on how the computer is being used. It is a good idea to check the clock setting on your computer frequently -- say, once a month, by comparing its displayed clock time against a standard such as http://www.time.gov/. Your clock should agree within less than a minute with this time standard; reset it as necessary.
For long-term data collection, it is worth considering using only standard time, and not changing to Daylight Saving Time. Although this will require at least some temporary adjustments to your computer clock, it is easier to do this than to merge two data sets taken when clock time changes in the spring and fall.
The U12 data loggers can be "launched" (to start recording) only under software control. The image shown here shows the "Launch Logger" screen displayed by HOBOware (the Pro version, although the Lite version is similar). NOTE: What you see on your screen may not be exactly the same as shown here, as later versions of this software may make minor changes. However, the basic functions will remain in place. The battery status is shown in the small graphic near the top of the screen. The channels to be recorded must be selected before launching. This logger is set to record output from three pyranometers. The CABLE-2.5-STEREO option identifies the Onset Computer Corporation part ID for a voltage input cable. You do not need this cable with an IESRE pyranometer, because a cable with an appropriate connector is supplied. If you are also attaching some other pyranometer, such as an Apogee PYR-P, you will need to provide an appropriate connector, as described in the previous section. Note that the U12 loggers are not "smart" loggers that can identify the devices attached to them. But, for this purpose, all that is needed is to select this voltage input cable from the list of options. You can ignore the "Scaling" option. There is also an option to record battery voltage. This takes as much logger memory as adding another data channel, so you should not select it unless you think you might be having battery problems. Because you will be downloading data every week or so, it is sufficient to check the battery status graphic every time you launch your logger.
For the "Logging Interval" select 1 minute. Once you have selected the "Logging Duration," the software calculates the maximum recording time until the logger's memory is full. For three channels recorded at 1-minute intervals, there is enough memory to store data for 10 days, 21 minutes. This time is only approximate because recording "events" by pressing the logger's button takes a little memory, too. You do not have to record events for this protocol.
The last step is to select a "Launch Option" option that controls when the logger will start recording data. The best choice for this protocol is the "At Interval" option, which will start recording at the next even minute if you have selected a 1-minute logging interval. The other options include starting "Now," at some specified future time ("Delayed"), and at some unspecified time ("Trigger") in the future, by pressing the button on the logger case. There is no reason to select any of these other options for this protocol.
Once you have done this a few times, and you are confident that everything is working as expected, you could check the box that will automatically launch your logger the next time, with the same options you have chosen this time. Probably you should not check this box.
Ideally, you should download data from your logger every week, even though with only one or two data inputs, it will store data for much longer than that. Why? Because things can go wrong! By downloading and checking your data regularly, you will minimize the chances for significant data losses. The least disruptive way to download data is to install HOBOware software on a laptop that can be taken to the observing site. If necessary, you can also disconnect the logger and bring it to a desktop computer. Of course, this will create a small time gap in your data.
HOBOware software refers to downloading your data as "Readout." Prior to "reading out" your data, you must first stop the logger. If you don't do this, you can still download data stored in the logger's memory, but the logger will continue to record and store data. Then, sooner than you expected, the memory will be full and the logger will stop recording. When this happens, it literally just stops. No data is lost, but you will lose measurements from the time the memory was filled. Note that these loggers store data in "non-volatile memory," which means that data will not be lost even if the battery needs to be replaced. You may lose some data when you thought the logger was recording, but all data up until the time when the battery was so depleted that it could no longer support storing measurements will still be there. For more information about this data logger's battery, see the next section.
By default, the software saves your downloaded data in a ".hobo" file. This is a proprietary file format that you can read only with HOBOware software. It is the file you send as an e-mail attachment when you report your data. When you download data, you can specify the file name and location (do not change the .hobo file name extension), and you are always offered the chance to plot the data. When the data plot is displayed, you can select an "Export as Excel text" option from the "File" menu. This creates a comma-delimited text file with a ".csv" file name extension. These kinds of files can be opened directly into Excel and other spreadsheet programs. The default file name is the same as the .hobo file name, but with a .csv extension. You should choose this option whenever you wish to save and analyze data yourself. The two images below are what you will see after you initially save the .hobo file and click on the "Plot" button. The data in this file show logging for three pyranometers that started at 10:00 am local time and continued until after dark. The sharp drop around 5:45 pm is when the loggers fell into shadow at this site (which is OK for calibrations, but not so great for measuring total daily insolation).
After you download data, it remains in the logger's memory until the next time you launch the logger. This means that if you somehow don't save a file properly, you can reconnect the logger and download the data again.
[site name][month, first three letters][day, two digits][year, 4 digits].hobo
For example, IESREAug082007.hobo. The date should be the end date of the data recorded, not the start date. Your official "site name" will be assigned when you register for this project.
If you export data to a .csv file, for your own use, please do not e-mail these data unless you have a specific question about them. The .hobo files are very compact and are a very efficient way to report these data. Whenever you download and report data, you should make an entry in your site logbook. You should also keep your own copy of all downloaded .hobo files as a backup.
As noted above, the U12-006 and U12-013 loggers loggers are not actually rated by their manufacturer for use in an outdoors environment. However, many people have used them outdoors without problems. They can be kept inside a louvered thermometer enclosure. If they do not have internal temperature and relative humidity sensors, you can keep them in a plastic sandwich box with kitty litter to absorb moisture. For very extreme outdoors environments, the "What You Will Need" section, above, references an "outdoor" version of this logger. However, you should not need to purchase this much more expensive logger. If you are in doubt, please contact IESRE.
These loggers are completely self-powered with a CR2032 button battery. Under normal conditions for this protocol, a battery can last for more than a year. (Extremely cold conditions will shorten the battery life.) However, you should keep a careful eye on the battery status graphic that appears every time you launch your logger. Once it falls into the lower part of this scale, you should replace the battery. Considering that these batteries are not very expensive, even purchased singly from a place like RadioShack, it makes no sense to try to delay changing a battery once its voltage starts to drop.
To replace the battery, remove the two screws from the back of the logger case. When you replace the battery, be sure to install the new one in the same orientation as the old one -- with the smooth surface with lettering up.
At some point, the results of a low battery voltage will be that your logger will stop logging and you will not be able to download data. However, data will not be lost. You can still retrieve whatever data are saved in memory by replacing the battery and downloading.
This Field Guide assumes that you have already installed your pyranometer and data logger.