|
|
|
It is not clear that the Excelitas sensors are rated for continuous outdoor use. They may not be entirely moistureproof and the transmission properties of the window covering the thermopile detector may not be stable under prolonged exposure to the sun. However, nighttime use is another matter. On rain-free nights it should be OK to point these devices up at the sky for prolonged periods. (It is still possible that dew collecting on the sensor could cause problems, and I realize that predicting rain-free nights is an imperfect process!) Ideally, a second sensor should be pointed down to measure surface radiating temperature. Taken together, these two sets of data give an interesting picture of incoming and outgoing IR radiation at Earth's surface.
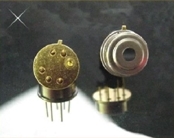
The Excelitas thermopile sensor pointed at the ground is designed to give the surface radiating temperature within a circular area defined by its 60° field of view. That is, it interprets the IR radiation coming from a real physical surface as the (area-averaged) temperature of that surface. This interpretation relies not just on having a real surface, but also on assumptions about the emissivity of that surface. (Often, such devices assume that the emissivity is 95%, which is typical for natural surfaces.)
What about a sensor pointed up at the sky? The sensor captures the IR radiation from the sky within its 60° field of view. But, the sensor doesn't see a real "surface" with a known emissivity. Not only is the emissivity of the sky with or without clouds unknown, but it is not even necessarily true that the sky with or without clouds behaves like a blackbody or greybody with an emissivity less than 1, with predictable emission properties as a function of wavelength and temperature. (An online search for "blackbody definition" will yield many sites which will explain this concept.) If the sky is overcast, it might be reasonable to interpret the sensor output as representing the temperature of the cloud base "surface." But, in general, the output from a thermopile sensor can no longer be called a temperature in the sense that the output from a sensor viewing the ground can be interpreted as a temperature. This fact does not make the data less interesting or less valuable, but it is important to be careful what you call the result of the factory calibration for converting voltage to temperature! Referring to this value as an "apparent temperature" (my preference) or an "effective temperature" would be much more appropriate. It is likely, by the way, that the sensor output will drop to zero under a cold, clear winter sky. This means that -26.75°C is the lowest apparent sky temperature that can be recorded.
In any case, data from an upward-facing thermopile sensor can be used to track the motion of clouds across most nighttime skies, something which obviously
cannot be done visually at night (except when there is sufficient moonlight). It may also be possible to track the motion of large haze, dust, or smoke
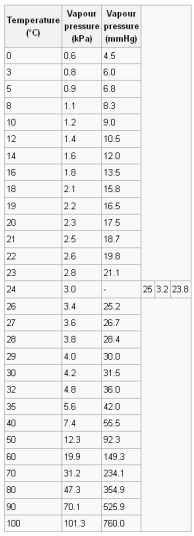
clouds across the sky. You can also convert temperature to radiated energy in units of watts per square meter, using the Stefan-Boltzmann law:
E = εσT4
where ε is the emissivity, ≤1, σ=5.6704×10⁻⁸ is the Stefan-Boltzmann constant, and T is
temperature in kelvins. (Tkelvin=T°C + 273.15.)
This conversion is straightforward for surfaces, using an emissivity of 0.95, for example, but it is not at all
obvious what to use for a sky emissivity of a blackbody (or greybody>) radiating at an apparent sky temperature.
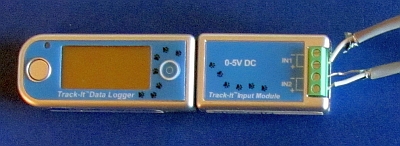
The design of a two-sensor experiment is conceptually very simple but, as always, there are implementation details to be considered. The sensors should be mounted on a long bar attached to a camera tripod, horizontal and roughly 1 m above the ground. Precise horizontal orientation of the sensors is not as important as it is for measuring insolation, for example. The sensor units can be powered with 9V batteries. However, even high-quality alkaline batteries will last only a few days. A better solution is to use rechargeable batteries and exchange them every couple of days, as needed. It is also possible to power the units with 6 D cells in series, which will give much longer run times. The minimum supply voltage for the LM78L05 voltage regulator used to power the thermopile sensor is 6.7 V.
One-minute sampling is appropriate for this measurement. You can use the instantaneous sample-and-save mode of the Track-It logger (the default mode) or you can sample at 2-s intervals and record the average of those samples over the longer 1-min interval. (See the Track-It manual for details.) This might result in a less noisy signal which may or may not be desirable.
You should plan on collecting other meteorological data along with the IR data. Data from a nearby National Weather Service (NWS) station are OK, but
it is better to collect air temperatures at your experiment site, if possible. Wind speed can affect surface temperatures.
Visual observations of cloud conditions at dusk and
dawn will be useful. Air and dewpoint temperatures are important – NWS stations report dewpoint temperature, or you can use air
temperature and relative humidity to calculate dewpoint.
(See this online application.) Cloud base height above ground
level is linearly related to the "spread," the difference between air and
dewpoint temperatures:
cloud base height above ground level, feet = (Tair - Tdewpoint)•400
when temperatures are given in °C. At least in the U.S., cloud base heights are usually given in feet, regardless of the units used
for temperature. Multiply feet by 0.3048 to convert the height to meters.
Although it adds to the cost of the experiment, I advise having a third sensor to serve as a reference. Prior to starting data collection, all the sensors should be mounted inside, pointed down at a uniform surface such as a bare floor. Record data and then check the output of the experiment sensors against the reference sensor. If you are going to mount two sensors outside, and if you have only one logger, you need to do this procedure twice, once for each sensor. Any discrepancies should be noted. If the discrepancies are significant, then before converting voltage to temperature, the output voltages of the experiment sensors should be multiplied by a constant which causes them to agree with the reference. The correction may or may not be a simple linear correction. Later on, during the experiment, this relative calibration procedure for the experiment sensors should be repeated periodically. If new discrepancies are found, this may be a sign that outdoor exposure is degrading the filter coating on the sensor housing.
Especially for an experiment which involves using equipment in environments for which they may not have been designed, this kind of quality control is absolutely essential. Careful attention to this matter will distinguish a research project that is just OK from a really good one.
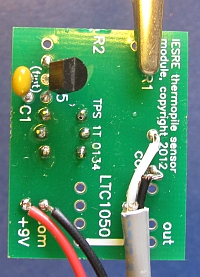
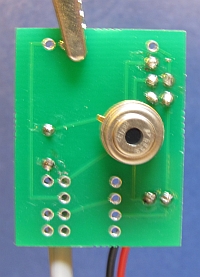
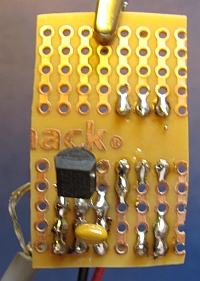
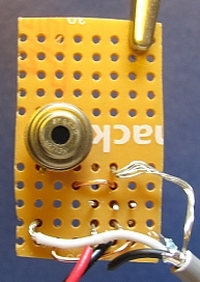
You can build this sensor circuit either on the pc board IESRE designed for the HOBO-compatible version without using the external op-amp, which is easy, or on some perf board, which is more tedious and prone to errors. (I built one on perf board, but probably not again, considering that I have the pc boards!)
 |  |  |
 |
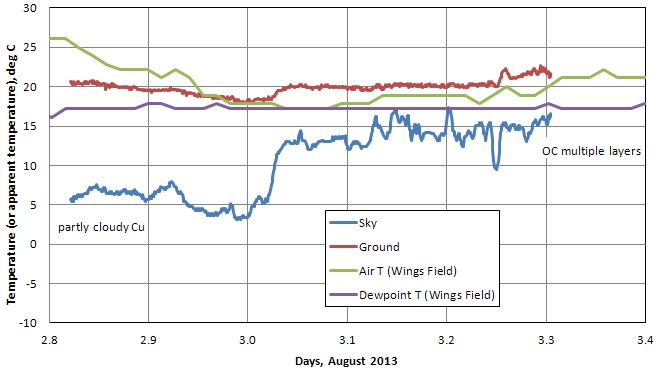
The graphs below show thermopile data for two nights in August 2013. The air and dewpoint temperatures are from a nearby small commercial airfield. It was unusually cool for August. On August 2-3, Partly cloudy conditions at dusk changed to overcast during the night. It started to rain on the morning of August 3 just after the sensors were brought inside. Two nights later it was very clear, dry, and cooler, with no almost no clouds except for a little cloud activity starting around 2 a.m. In the morning, there was a lot of dew condensed on the equipment, but it didn't seem to affect the performance of the sensors. It is possible that the "cloud activity" inferred from the thermopile sensor data might be due to condensation on the sensor – a possibility that needs further study. The fractional day time is based on Eastern Standard Time, not (local) EDT.
 |
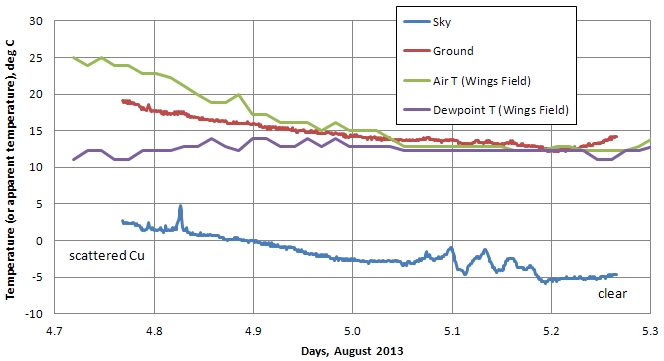 |
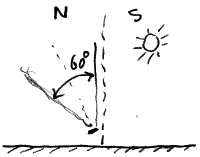
Although there may be some problems with long-term exposure of the Excelitas sensors to sunlight, I don't know for sure because I haven't tried it. You are invited to try collecting daytime data and let me know what happens (see the email link below). I suggest orienting the upward-facing sensor not straight up, but (in the northern hemisphere) facing north at an angle down from the zenith sky so the sun is never within the sensors's 60° field of view. If you collect daytime data, periodic calibrations against an indoor reference standard are even more important to monitor the long-term performance of your outdoor sensors.