|
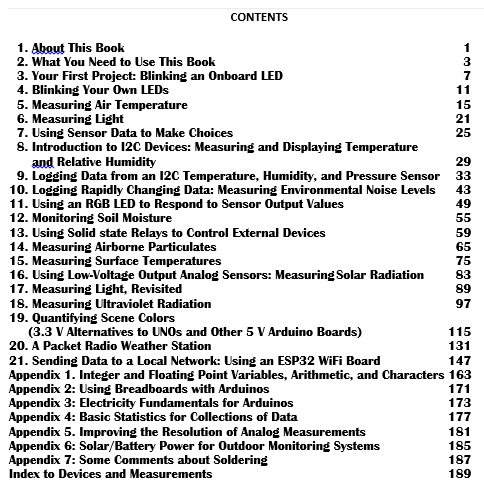
The image shows the contents for this book. Some of the documents on this page
reference the book, which is available for $25 including shipping to any U.S.
address. Contact brooskdr@instesre.org. All book proceeds go to support the
mission of the Institute for Earth Science Research and Education..
When errors are found in the book they will be noted here: |
 |
| This document shows how to use RGB LEDs, including boards using 5050 RGB LEDs. Several examples are given, with breadboard layouts and code for controlling single and multiple LEDs, including using PWM to control LED brightness. | 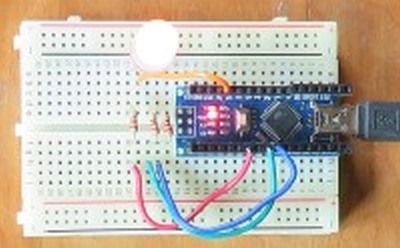 |
| This document describes several options for displaying data collected with Arduinos, ranging from simple LCD text displays to TFT displays for creating full-color graphics | 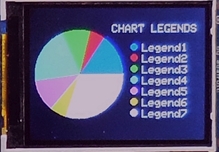 |
| This document compares data from two inexpensive Arduino-compatible airborne particulate sensors. Both devices use a single laser beam that's deflected by particulates in a fan-driven air stream flowing past the laser. Both sensors reliably track time-dependent variability in particulates, but the quantitative mass density values are considerably different. | 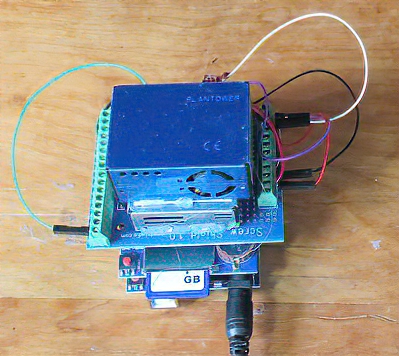 |
| This document shows how to use piezo vibration sensors. It suggests that rather than depending on Arduino's very coarse 10-bit 0-5 V A/D resolution, a 16-bit programmable gain ADS1115 A/D board is a much better choice for detecting small vibrations such as might be encountered from heavy traffic or construction activities. | 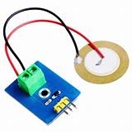 |
| This document shows how to use Arduino's interrupt-processing capabilities to look for pulses from a Geiger counter built from a kit. The code counts pulses and calculates counts per minute. This kind of code can be adapted to any situation where it's necessary to look for events that happen randomly, with only a very fast and transient indication of their occurrence. | 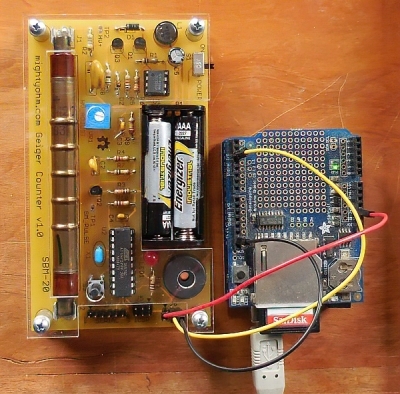 |
| This document shows how to use data logging shields for collecting and storing data. Although it may be more "modern" to think of storing data online, there are still many good reasons for collecting, recording, and storing data locally with date/time stamps. Data logging shields make this possible. They are widely and inexpensively available online for UNO and Nano Arduino boards. | 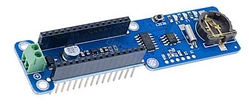 |
| Although UNOs and Nanos are almost always suitable for data collection projects with
multiple sensors, projects that use graphic display devices can sometimes cause program
memory problems. The software libraries required to use TFT and eInk displays take a lot of program memory. An option for users who are already comfortable using UNOs and Nanos is to use a Mega 2560. This board has eight times the program memory space as an UNO or Nano. UNO data logging shields will fit on Mega boards, but some adjustments must be made to pin assignments, and the topic is explored in detail in this document. | 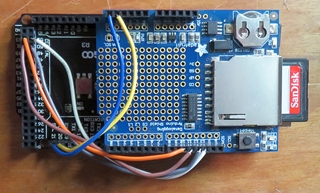 |
| See Comparing PMS5003 and Sensirion SPS30 particulate sensors, above. This document performs a similar comparison between PMS5003 and HM3301 particulate sensors with an I2C interface. | 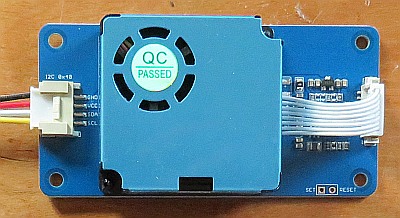 |
| This document provides an introduction to the new Arduino UNO R4 MINIMA. This board has the same physical layout as the UNO R3, and it's supposed to accept R3 code without modification – an assumption that turns out to be not entirely true, depending on what hardware you attach to the board! The R4 uses a different microprocessor that offers several advantages over the R3, including 8 times more memory for storing code compared to the R3! This board may override the need to use a more expensive UNO Mega to get more program storage space for large projects. | 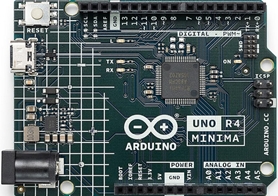 |
| My book Environnmental Monitoring with Arduino Microcontollers shows how to use two I2C multispectral sensors from Sparkfun.com -- one with 6 VIS channels and one with 6 NIR channels. (Those two sensors have the same I2C address, so a multiplexer is needed to use both of them on the same Arduino.) This document shows how to use a 10-channel multispectral sensor, the I2C AS7341 from Adafruit.com, which has 8 VIS channels, a broadband "clear" channel, and an NIR channel. The code presented in the document displays raw data from the 10 channels on a small OLED and draws a full-color bar graph showing those data. | 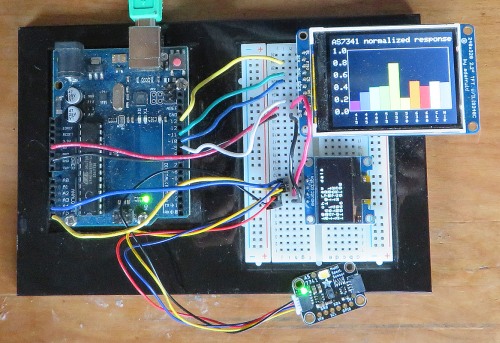 |
|
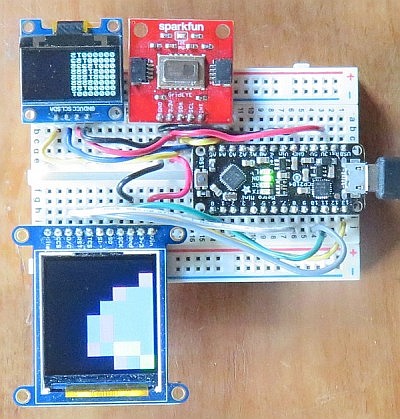
The AMG8833 is an interesting low-resolution 8×8 pixel
"thermal camera." This document provides code for using this sensor to
produce 64 16×16-pixel colored squares on a small TFT display, where the
colors are based on the thermal response of each pixel on the sensor.
This
device will detect a human presence at least a few feet away when
viewed against a relatively uniform thermal background that's cooler
than a human body. The AMG8833 breakout board is from SparkFun.com and the Arduino board is an UNO code-compatible MetroMini from Adafruit.com. There are six possible colors, ranging from black for temperatures cooler than some selected minimum, to red for the warmest sensor pixels. A small OLED displays the matrix containing the 64 color selection values. |
 |
|
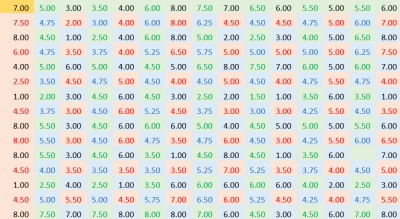
The thermal sensor document on this page
shows how to use an AMG8833 8×8 pixel thermal
sensor to produce a matrix of 64 16×16 pixel color squares s on a small
TFT display. The visual appearance of these data can be enhanced by interpolating
the original 8x8 matrix to a 15×15 matrix to produce 225 8×8 pixel pixel color squares
on the TFT display. This document shows how to write an Arduino sketch that starts with an 8×8 matrix and produces a 15×15 interpolated matrix, using two-dimensional arrays. The image here shows this interpolation done in Excel, which I used as a guide for writing the code. |
 |
| This document shows how to use a small generic data logging module for Arduino 5 V boards that don't share the UNO R3/R4 or Nano physical layout, like Arduino ProMinis or Pros. (There are data logging modules that plug into the headers of UNOs and Nanos.) There's no data logging shield for Adafruit.com's MetroMini, a board that is recognized as an UNO R3 by the Arduino IDE, but which is about the same size as, but not pin-compatible with, a Nano. | 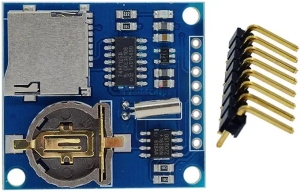 |
| This document shows how to use an inexpensive 4×4 membrane keypad with an Arduino. There's some basic code for a Nano to record key presses and a sketch that shows how to enter and test a seven-character password against a password stored in the source code. | 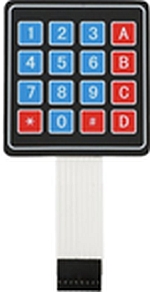 |
| Record high temperatures across the U.S. and Europe during the summer of 2023 motivated this project. This Document shows how to use an MLX90614 IR sensor to monitor ground temperatures in urban heat islands and other microclimates. The image shows a sensor system recording temperatures of a gravel driveway on a warm sunny day. | 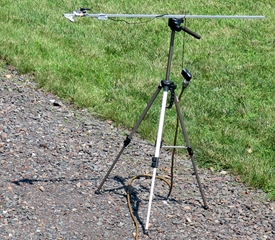 |
| The previous entry in this list described using an MLX90614 IR sensor to monitor surface temperatures. This Document gives details about building such a system. The document was developed as part of IESRE's role as a science consultant to ECoSTEM, a project at Xavier University of Louisiana funded by the National Science Foundation's Improving Undergraduate STEM Education program. There are instructions for a building an Arduino Nano-based "breadboard" thermal sensing system at an in-person workshop for secondary school students, and a complete system including a lux sensor for logging temperature data in urban heat islands and other microenvironments. | 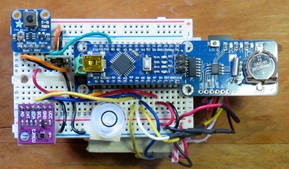 |
| Chapter 19 in Brooks' book Monitoring Your Environmental with Arduino Microcontrollers shows how to use SparkFun spectral sensor breakouts with Adafruit's Feather M0 Express board. This Document shows an alternative approach using Adafruit's MetroMini UNO-compatible board. A small OLED is used to display data. | 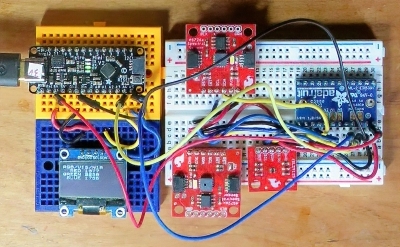 |
|
Julian dates are used for astronomical calculations and for solar tracking applications. Because of
some limitations with Arduino floating point variables, some tricks are needed to calculate a
Julian Date accurately. This document shows
how to do it.
The code also provides an example of how to read a string of characters representing numerical values typed in the COM port window (for this project, integers for the year, month, day, hour, minute, and second) and then split that character string into an array of integers. The same basic procedure will also work for floating point numbers. | 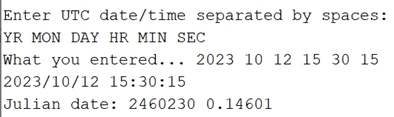 |
| Solar radiation reaching Earth's surface is usually measured with pyranometers. Graphs of these data show diurnal variation in solar radiation, including effects due to variable cloud cover. Lux sensors, which respond to light as perceived by human eyes, can also be used to monitor daytime sky conditions. including cloud effects. This document shows how to build an inexpensive Arduino Nano-based system to collect and log lux, temperature, and relative humidity data. | 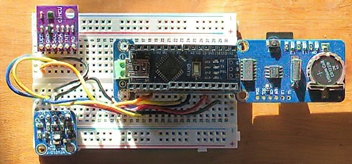 |
| Lithium-Polymer (LiPo or LiPoly) batteries are widely used in low-power Arduino projects. It's important to use batteries from a reliable vendor and chargers that are specifically designed for safely charging and maintaining these batteries. This document provides a brief discussion of the hardware IESRE uses for its LiPo-powered Arduino projects. | 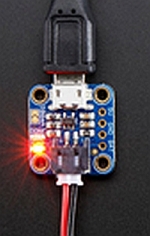 |
|
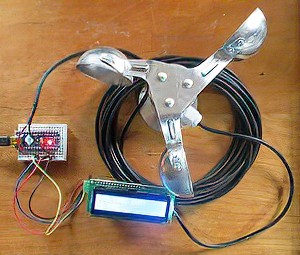
Wind speed is an essential meteorological parameter. Anemometers are instruments
used to collect these data. For routine monitoring activities, these devices
often use three cups to collect the wind, causing a shaft to rotate.
The rotation speed is related to wind speed. This document shows how to use an inexpensive three-cup anemometer that produces a voltage (0-3.8 VDC) proportional to the wind speed up to about 70 mph. This is a completely passive device so it's very easy to use with just two Arduino connections – to an analog input pin and ground. The image shows the anemometer with a Nano and an LCD to display the output voltage when the shaft is rotating. |
 |
|
Measuring airborne particulates is the central science focus for the National Science
Foundation-funded ECoSTEM project at Xavier University of Louisiana, for which IESRE serves as
the science consultant. Inexpensive laser-based and Arduino-compatible sensors are used for this
project and data are collected for PM1, PM2.5, and PM10 particulates. While the PM values themselves
are of interest, it's also desirable to convert the PM2.5 and PM10 values into their corresponding
AQI values as defined by the U.S. Environmental Protection Agency. These
values are used by the EPA to
assign health risks due to airborne particulates. The reported AQI is based on the maximum
AQI associated with each of six pollutants – O3, PM2.5, PM10, CO, NO2,
and SO2. Especially
in urban areas, the PM2.5 AQI is often the pollutant that defines the reported AQI. This document provides Excel formulas and Arduino code for converting PM2.5 and PM10 values into their AQI values. | 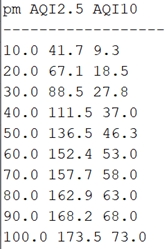 |
| Airborne particulates can cause health problems if their values are too high. This document shows some particulate data collected indoors near a woodstove and converted to their AQI values as defined by the U. S. Environmental Protection Agency, using calculations as described in the previous document in this list. | 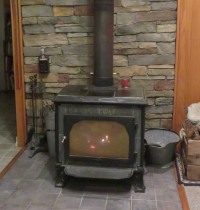 |
| Adafruit's HUZZAH32-ESP32 board is a popular choice for WiFI/IoT applications. This document shows pin assignments for interfacing Adafruit's 1.44" full-color TFT display with this board. Those assignments should work for other Adafruit TFTs, too. | 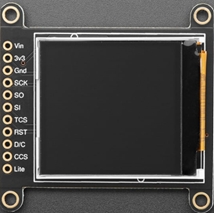 |
|
There are many full-color TFT displays available from vendors like Adafruit.com
and online. A less expensive but equally usable alternative is the older ILI9225 176×220
pixel TFT available from MPJA.com and other online sources.
This document shows how to use the ILI9225 to create data graphs. The image
shows sine and cosine curves. Code is also included for displaying temperature, humidity,
barometric pressure, and Air Quality Index values for airborne particulates. The pixel count is a little lower than newer similarly sized TFTs but it's still useful for many applications. A possibly useful feature of this SPI device is that is can be plugged directly onto the UNO header that includes power, ground and analog input pins. That feature then requires use of software SPI rather than faster hardware SPI. It also ties up analog pins A0 through A5, which will be a problem if your application needs these pins for analog output or I2C devices that use analog pins A4 and A5. By using a breadboard the pins can be wired to the usual digital pins for hardware SPI. | 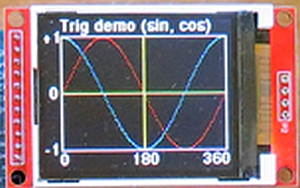
|
|
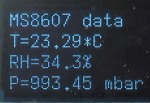
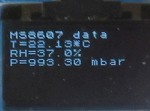
This document compares Adafruit's MS8607 T/RH/P sensor (shown in the
image) with
BME280 T/RH/P and AM2315C T/RH sensors. The BME280 is widely
used in Arduiino-based weather station applications, but its relative humidity performance
always degrades catastrophically in outdoor applications where relative humidity varies
over a very wide range. It's possible that the other two sensors, which are designed to promote better air flow around the sensing element, will be less prone to saturation of the hygroscopic dielectric materials used in the humidity sensor, and will also reduce self-heating of the temperature sensor that's required to convert absolute humidity to relative humidity. The MS8607 module, which allows air flow around three sides of the sensing element, should be an improvement over the BME280 module, where the sensing element is mounted directly on the PC board with no air space around it. | 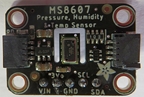
|
| This document gives an introduction to using small monochrome OLEDs for displaying data with text or graphics. These devices work well with Nanos, for example, but large programming projects that require a graphics library will strain the Nano's programming capabilities. One solution is to use Arduino's Nano Every – a newer board that's pin- and performance-identical to the Nano but has much more space for code. The image here shows a Nano Every project that displays PM 1, PM 2.5, and PM 10 values on three horizontal bar graphs. | 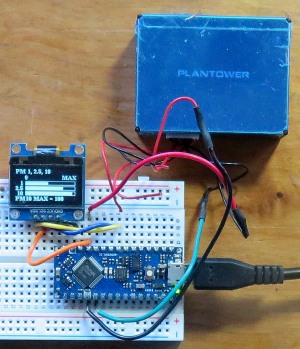
|
I often use small OLEDs with the u8x8 text-only library. Here are some images showing three different fonts, found HERE, to be entered as the parameter into a u8x8.setFont(); statement. The font I often use with IZOKEE 0.96" OLEDs (the middle image below) is readable, but very small! The left-hand image is much easier to read if your data will fit in 4 lines, no more than 15 characters per line. The large font in the right-hand image, from a sketch that I use to test new OLEDs, is the same height as the font in the left-hand image, but wider – like a bold font. It's good only for displaying a limited amount of data.
u8x8_font_7x14_1x2_f (4 lines,15 characters each)
u8x8_font_chroma48medium8_r (A very small font!)
u8x8_font_px437wyse700a_2x2_r (4 lines, 7 characters per line)
 |
 |  |
| Noise can be a significant environmental "air pollutant," especially in urban areas where there is constant noise from traffic, construction, and other sources. This document shows how to monitor noise with an Arduino-compatible sound meter module. It incorporates a small electret microphone like the one shown in the image into a complete module that converts sounds to an analog voltage that can then be converted to decibels, the standard way to quantify noise. | 
|
| This document shows how to use nRF24L01+ RF modules operating in the license-free 2.4 GHz radio band to collect and display environmental data. These inexpensive modules are widely available online with on-board antennas for ranges of several 10s of meters indoors and screw-on "rubber duck" antennas for outdoor ranges up to 1 km under ideal open-air conditions. They are alternatives to the 915 MHz and 433 MHz RF devices described in Chapter 20 of David Brooks' book Monitoring Your Environment with Arduino Microcontrollers. The nRF24L91+ is the small pc board at the bottom of the image. | 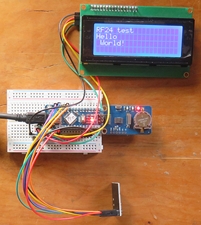 |
| This document shows how to use negative temperature coefficient (NTC) thermistors for monitoring temperatures. These devices are inexpensive, accurate, and easy to interface with Arduinos. They come in a variety of configurations, including the one shown in the image with 1 m stranded wire leads, to which short solid wires have been soldered for use with breadboards. The thermistor sensor is in the upper left-hand corner of the image. The Nano-based system includes a TMP36 temperature sensor for comparison. | 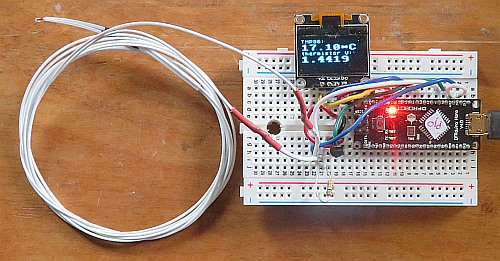 |